
The U.S. economy unexpectedly shed 92,000 jobs in February, missing economist forecasts for a 60,000-job gain. Unemployment edged up to 4.4% from 4.3%.
However, Data Explained examined Bureau of Labor Statistics (BLS) data and found that the labor market’s four-year post-COVID stability has begun to crack.
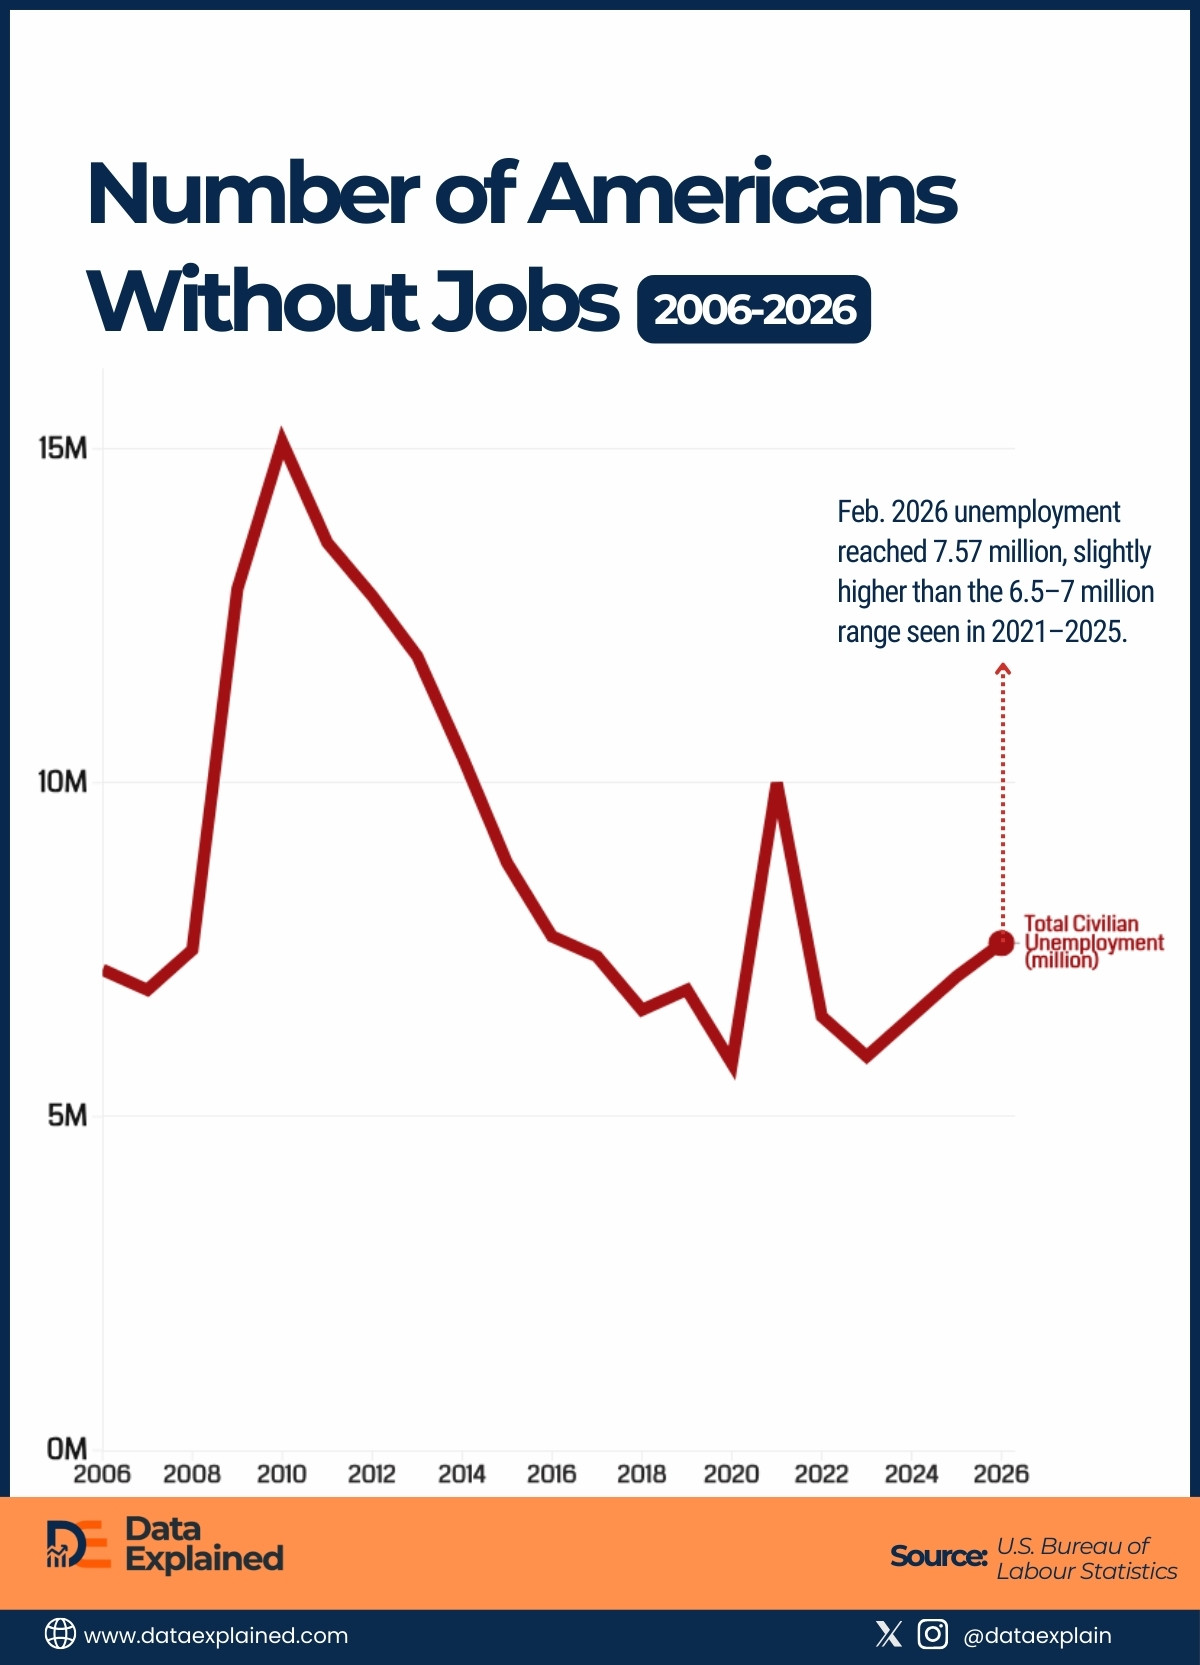
The visualisation above shows the trend of civilian unemployment from 2006.
After recovering from the pandemic’s 24-million-unemployed peak in 2020 and maintaining steady levels around 6-7 million jobless (roughly 4% unemployment) from 2022 through 2025, the trend line shows an uptick in 2026, with current unemployment at approximately 7.5 million.
TL;DR
- February 2026 unemployment reached 7.57 million, slightly higher than the 6.5–7 million range seen in 2021–2025.
- Current unemployment levels are similar to pre-2006 figures, showing that the market is rising but not yet at crisis levels.
- Historical data show small upticks often precede recessions, emphasizing that rising unemployment could signal potential future economic strain.
Total Civil Unemployment in February (2016-2026)
| wdt_ID | wdt_created_by | wdt_created_at | wdt_last_edited_by | wdt_last_edited_at | Year | Total Civilian Unemployment (million) |
|---|---|---|---|---|---|---|
| 1 | emmanuel-ashemiriogwa | 13/03/2026 09:28 AM | emmanuel-ashemiriogwa | 13/03/2026 09:28 AM | 2006 | 7.20 |
| 2 | emmanuel-ashemiriogwa | 13/03/2026 09:28 AM | emmanuel-ashemiriogwa | 13/03/2026 09:28 AM | 2007 | 6.90 |
| 3 | emmanuel-ashemiriogwa | 13/03/2026 09:28 AM | emmanuel-ashemiriogwa | 13/03/2026 09:28 AM | 2008 | 7.50 |
| 4 | emmanuel-ashemiriogwa | 13/03/2026 09:28 AM | emmanuel-ashemiriogwa | 13/03/2026 09:28 AM | 2009 | 12.90 |
| 5 | emmanuel-ashemiriogwa | 13/03/2026 09:28 AM | emmanuel-ashemiriogwa | 13/03/2026 09:28 AM | 2010 | 15.10 |
| 6 | emmanuel-ashemiriogwa | 13/03/2026 09:28 AM | emmanuel-ashemiriogwa | 13/03/2026 09:28 AM | 2011 | 13.60 |
| 7 | emmanuel-ashemiriogwa | 13/03/2026 09:28 AM | emmanuel-ashemiriogwa | 13/03/2026 09:28 AM | 2012 | 12.80 |
| 8 | emmanuel-ashemiriogwa | 13/03/2026 09:28 AM | emmanuel-ashemiriogwa | 13/03/2026 09:28 AM | 2013 | 11.90 |
| 9 | emmanuel-ashemiriogwa | 13/03/2026 09:28 AM | emmanuel-ashemiriogwa | 13/03/2026 09:28 AM | 2014 | 10.40 |
| 10 | emmanuel-ashemiriogwa | 13/03/2026 09:28 AM | emmanuel-ashemiriogwa | 13/03/2026 09:28 AM | 2015 | 8.80 |
Breaking Four Years of Stability
The U.S. labor market’s four-year post-COVID stability is showing early cracks as February 2026 saw civilian unemployment rise to roughly 7.5 million after remaining around 6.5 to 7 million from 2021 to 2025.
Historically, pre-2008 unemployment hovered near 7 million.
This has been supported by industrial expansion, mass production, and the growing service sector, which provided resilient employment opportunities despite AI intrusion.
Comparing trends from 2006 to 2026, February unemployment was relatively stable, with a gradual post-pandemic recovery following the 2020 peak of 24 million unemployed.
Yet, the 2026 spike signals that stability may be ending.
Underlying pressures, including demographic shifts, sectoral realignment, and broader economic adjustments, are likely influencing these changes.
Current Level Is Low, But Rising
The current February 2026 civilian unemployment stands at approximately 7.57 million, with a rate of 4.4 percent.
While this is slightly higher than the historic 4.1 percent, it remains within a normal range compared to pre-2006 levels, when similar unemployment figures were recorded.
This means that, although the number is rising, it is not yet at a crisis level.
Historical patterns show that small upticks often precede larger shifts in employment and economic activity, making the direction of change more important than the absolute level.
Monitoring these early changes is crucial because continued increases could signal weakening labor market conditions,
By February 2027, the situation may evolve, and what is currently moderate unemployment could escalate if underlying pressures persist.
We’re at 2006 Levels Again
In 2006, civilian unemployment hovered around 7 million just before the recession.
While moderate at the time, these figures reflected pressures building in the labor market, including a slowdown in job creation and sectoral imbalances.
Rising unemployment reduced purchasing power, as households spent less on goods and services.
This decline in consumption contributed to inflationary pressures, which in turn strained both businesses and consumers, creating a feedback loop that intensified the economic slowdown.
Interest rates rose in response, making borrowing more expensive for businesses and households.
Comparing these historical patterns with February 2026’s unemployment of approximately 7.5 million suggests caution.
Although not yet at crisis levels, the trajectory mirrors past conditions that preceded recessions.
ELI5
The U.S. job market has been mostly steady for the past few years, with about 6.5 to 7 million people unemployed.
In February 2026, the number rose to 7.57 million, slightly higher than usual but still not dangerous.
Looking back, this level is similar to what the country experienced before the 2006 recession, when small increases in unemployment eventually led to larger problems, including reduced spending, higher prices, and an economic slowdown.
Even though things aren’t at a crisis yet, the trend shows we need to watch carefully because small rises now can become bigger troubles later.
Sources: