Vladimir Putin lands in Beijing on Tuesday, May 19, hours after Donald Trump’s departure following his own summit with Xi Jinping last week.
The official occasion is the 25th anniversary of the 2001 Treaty of Good-Neighborliness and Friendly Cooperation.
Analysts describe the significance as running considerably deeper. And the timing, one day after Trump left, is not incidental.
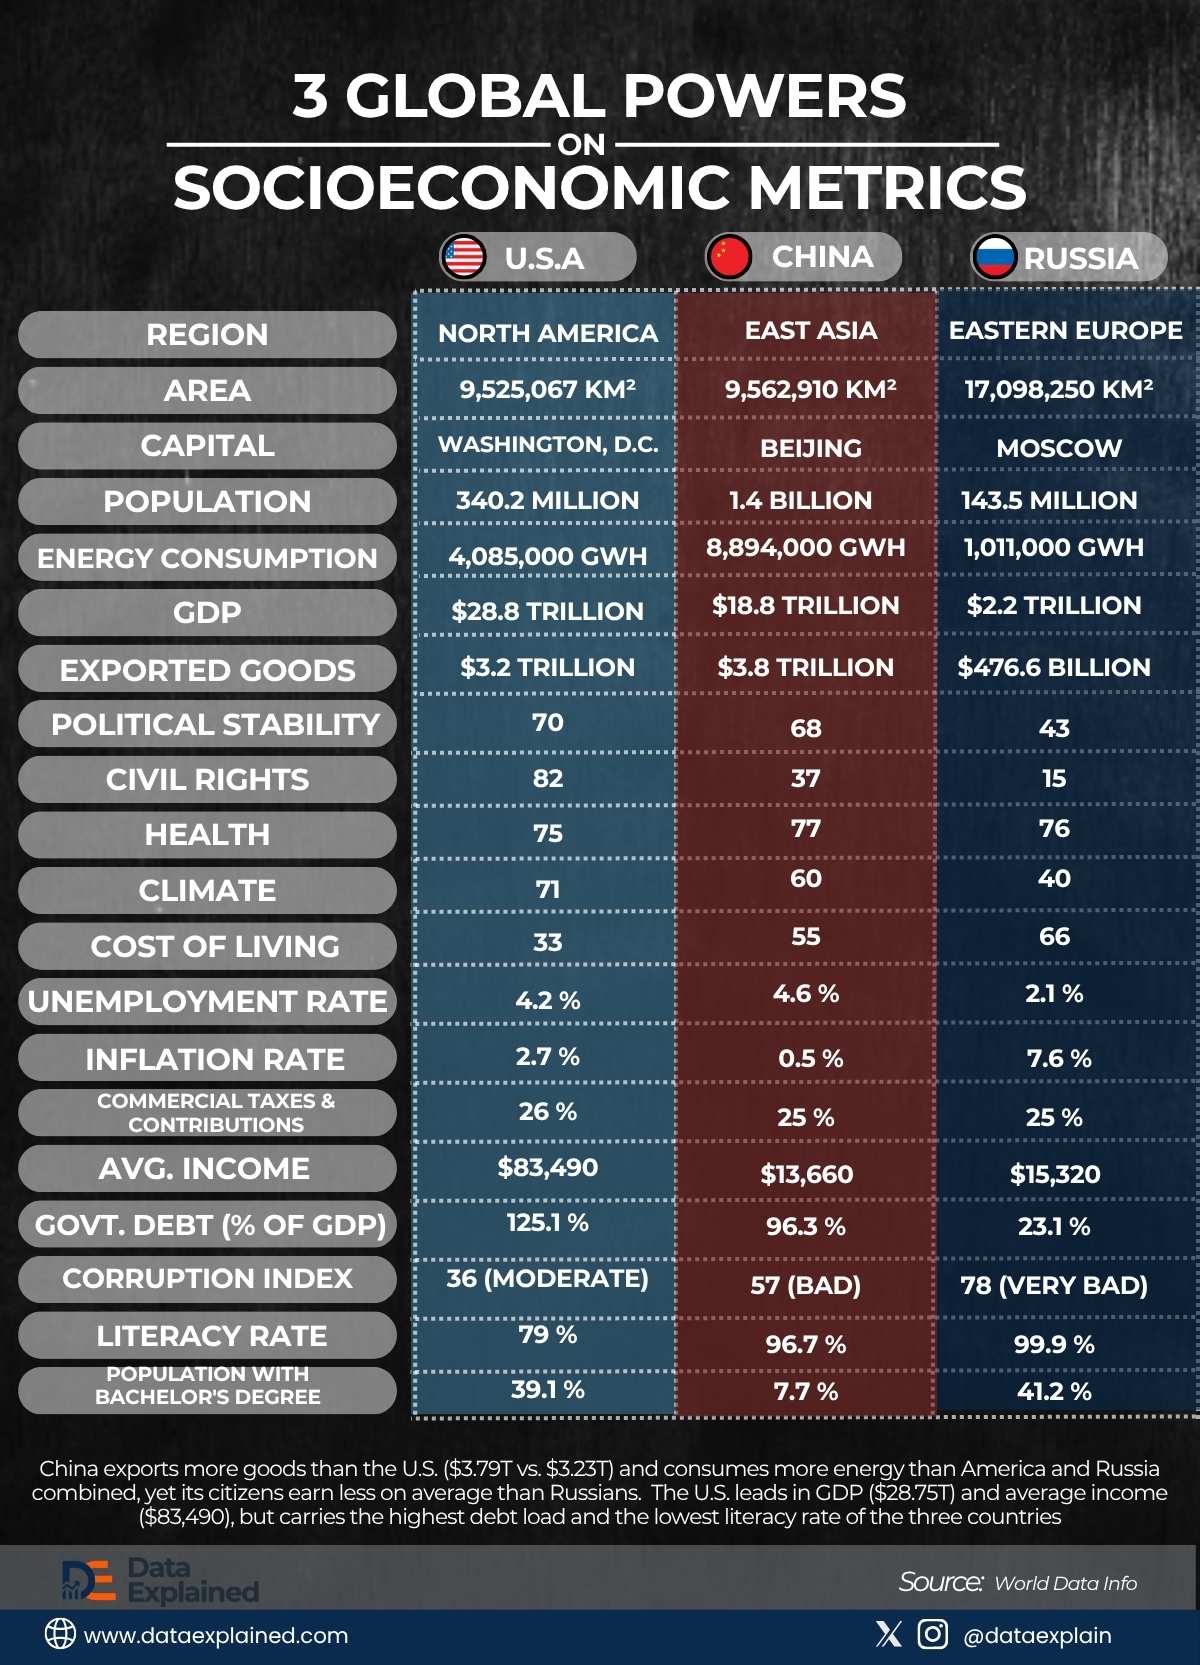
Using the information from World Data Info, the visualization above compares all three countries across 20 socioeconomic metrics.
The data context helps to understand what each leader brings to the geopolitical table.
TL;DR
- Russia’s government debt is just 23% of GDP, far lower than China’s 96% and America’s 125%, giving the country fighting an active war under sanctions more fiscal room than either rival
- China exports more goods than the U.S. ($3.79T vs. $3.23T) and consumes more energy than America and Russia combined, yet its citizens earn less on average than Russians.
- The U.S. leads in GDP ($28.75T) and average income ($83,490), but carries the highest debt load and the lowest literacy rate of the three countries
| wdt_ID | wdt_created_by | wdt_created_at | wdt_last_edited_by | wdt_last_edited_at | Metric | China | United States | Russia |
|---|---|---|---|---|---|---|---|---|
| 1 | emmanuel-ashemiriogwa | 19/05/2026 12:29 PM | emmanuel-ashemiriogwa | 19/05/2026 12:29 PM | Region: | East Asia | North America | Eastern Europe |
| 2 | emmanuel-ashemiriogwa | 19/05/2026 12:29 PM | emmanuel-ashemiriogwa | 19/05/2026 12:29 PM | Area: | 9,562,910 km² | 9,525,067 km² | 17,098,250 km² |
| 3 | emmanuel-ashemiriogwa | 19/05/2026 12:29 PM | emmanuel-ashemiriogwa | 19/05/2026 12:29 PM | Capital: | Beijing | Washington, D.C. | Moscow |
| 4 | emmanuel-ashemiriogwa | 19/05/2026 12:29 PM | emmanuel-ashemiriogwa | 19/05/2026 12:29 PM | Population: | 1,408,975,000 | 340,111,000 | 143,534,000 |
| 5 | emmanuel-ashemiriogwa | 19/05/2026 12:29 PM | emmanuel-ashemiriogwa | 19/05/2026 12:29 PM | Energy consumption: | 8,894,000.0 GWh | 4,085,000.0 GWh | 1,011,000.0 GWh |
| 6 | emmanuel-ashemiriogwa | 19/05/2026 12:29 PM | emmanuel-ashemiriogwa | 19/05/2026 12:29 PM | Gross domestic product: | 18,743,803 M US$ | 28,750,956 M US$ | 2,173,836 M US$ |
| 7 | emmanuel-ashemiriogwa | 19/05/2026 12:29 PM | emmanuel-ashemiriogwa | 19/05/2026 12:29 PM | Exported goods: | 3,792,951 M US$ | 3,232,522 M US$ | 476,686 M US$ |
| 8 | emmanuel-ashemiriogwa | 19/05/2026 12:29 PM | emmanuel-ashemiriogwa | 19/05/2026 12:29 PM | Political stability: | 68 | 70 | 43 |
| 9 | emmanuel-ashemiriogwa | 19/05/2026 12:29 PM | emmanuel-ashemiriogwa | 19/05/2026 12:29 PM | Civil rights: | 37 | 82 | 15 |
| 10 | emmanuel-ashemiriogwa | 19/05/2026 12:29 PM | emmanuel-ashemiriogwa | 19/05/2026 12:29 PM | Health: | 77 | 75 | 76 |
The United States leads in GDP at $28.75 trillion. China follows at $18.74 trillion. Russia trails at $2.17 trillion, an economy smaller than Italy’s.
By economic scale alone, Russia appears to be the junior partner in every bilateral relationship at this week’s summit.
The debt picture complicates that reading entirely.
According to World Data Info, Russia’s government debt stands at 23.05% of GDP. China sits at 96.26%. The United States carries 125.05% (the highest of the three).
The country fighting an active land war under comprehensive Western financial sanctions has more fiscal headroom than either of its principal geopolitical rivals.
China, the Export Giant With Underpaid Citizens
China is the world’s largest goods exporter at $3.79 trillion, ahead of the United States at $3.23 trillion.
That single data point frames the entire U.S.-China trade war dynamic.
Trump’s tariff regime targets a country that exports more goods than America does. The leverage runs in both directions.
China also consumes more energy than the United States and Russia combined (8,894,000 GWh, compared with the U.S.’s 4,085,000 GWh and Russia’s 1,011,000 GWh).
It reflects the manufacturing intensity of an economy that produces approximately 65% of U.S. GDP but requires 218% of U.S. energy to do so.
Yet Chinese citizens earn $13,660 on average, less than Russia’s $15,320 and a fraction of America’s $83,490.
China’s aggregate economic scale is enormous because of population size (1.409 billion people generating $18.74 trillion in GDP produces a lower per-capita income than 143.5 million Russians generating $2.17 trillion).
The Triangle the Data Describes
Three leaders met in Beijing within days of each other this week.
Their countries’ combined GDP of approximately $49.7 trillion represents roughly half of global economic output.
The data assembled on all three do not predict outcomes. It describes the players:
- An American president managing the world’s largest economy with the highest debt load and an active trade war against the world’s largest goods exporter
- A Chinese president presiding over manufacturing scale and energy consumption that has no equal, with citizens earning less than Russians
- A Russian president carrying a wartime economy with a fraction of his rivals’ GDP but more fiscal room than either of them, arriving in Beijing one day after the Americans left.
ELI5
Trump visited China’s leader Xi, then Putin visited Xi right after. The data shows three very different countries: America is the richest but owes the most money. China makes and sells more stuff than anyone, but pays its workers less than Russia does. Russia has the least money overall but also the least debt, meaning it’s less financially trapped, even while fighting a war.
Source:
World Data Info | Russia’s TASS news agency