At its most basic level, data is a collection of raw facts. It can be numbers, words, images, sounds, or measurements.
On its own, a single piece of data does not tell you very much. For example, the number 37 is just a number. But when you learn that 37 degrees Celsius is the temperature outside, it suddenly becomes useful.
That is when data turns into information.
So, what is data? Data is defined as a value or a set of values that represent a specific concept or set of concepts. Data becomes ‘information’ when analyzed and, if combined with other data, can extract meaning and provide context.
Think of data like the ingredients in a kitchen. Flour, eggs, sugar, and butter are just separate items sitting on a counter. They do not mean anything by themselves. But when you combine them in the right way, you get a cake.
Data works the same way.
When raw facts are collected, organized, and processed, they become information that people can use to make decisions.
The word “data” comes from the Latin “datum,” meaning “something given.”
In everyday life, you constantly create and interact with data, whether you realize it or not.
Every time you send a text message, take a photo, make a purchase, search for something online, or even walk past a security camera, data is being created.
There is an important chain to understand here.
It starts with data (raw facts) > which becomes information (organized and useful facts) > which then becomes knowledge (understanding based on that information), and finally leads to > decisions (actions taken based on knowledge).
Every business, hospital, government office, school, and scientific lab in the world follows this chain every single day.
Chapter 1: A Brief History of Data
Humans have been recording data for thousands of years.
The earliest known examples date back over 20,000 years, when people carved tally marks into animal bones to keep track of things like days, animals, or trades.
In ancient Mesopotamia, around 3,400 BCE, people pressed marks into clay tablets to record crop harvests, tax payments, and business deals.
These were some of the first structured data records in history.
For centuries, data was recorded on paper. Books, ledgers, and filing cabinets held the world’s information.
The first major shift came in 1890, when the United States Census Bureau used punch cards to process census data. A machine invented by Herman Hollerith could read holes punched into cards and automatically count the results.
This single invention laid the groundwork for modern computing.
The next giant leap came with the advent of electronic computers in the mid-1900s. Early computers used magnetic tape to store data. By the 1970s and 1980s, floppy disks and hard drives made it easier to store and retrieve information.
The invention of the World Wide Web in 1991 by Tim Berners-Lee changed everything. Suddenly, data could be shared across the globe in seconds.
The 2000s brought the smartphone revolution.
When Apple released the iPhone in 2007, it put a powerful data-generating device in the pockets of millions.
Social media platforms like Facebook (2004), YouTube (2005), Twitter (2006), and Instagram (2010) turned billions of people into data creators.
Today, data is generated at a speed and volume unimaginable just 20 years ago.
Why Data Matters Today
Data is now one of the most valuable resources on Earth.
Many experts have called it “the new oil” because, just like oil powered the industrial age, data is powering the digital age.
Nearly every decision made by businesses, governments, doctors, scientists, and educators today is influenced by data
DID YOU KNOW?
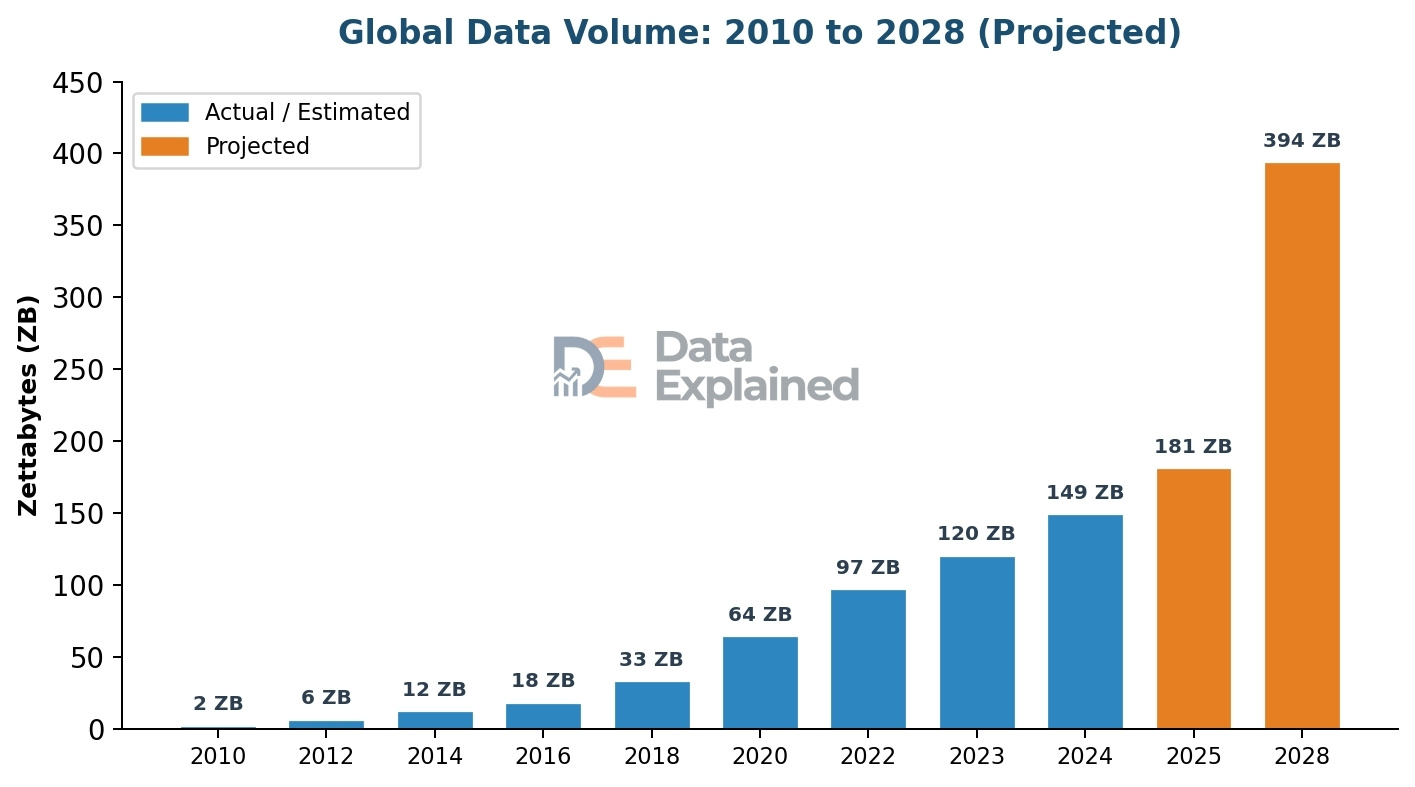
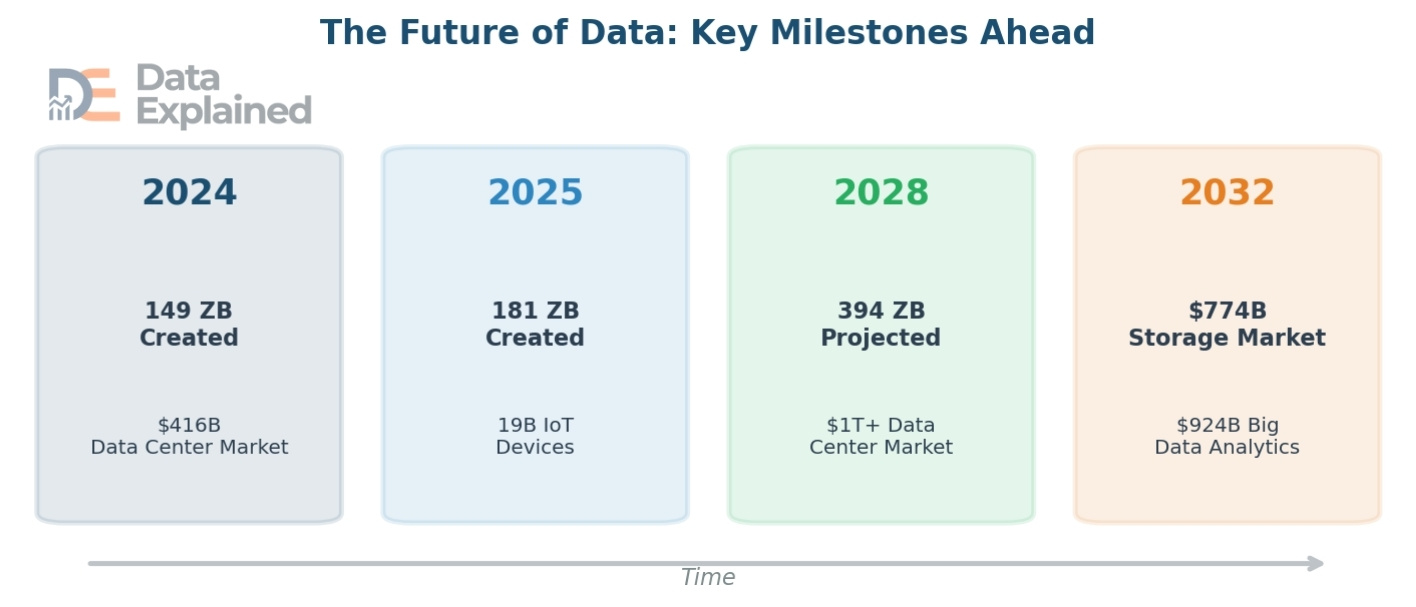
In 2024, the world created, captured, copied, and consumed about 149 zettabytes of data.
By the end of 2025, that number was expected to reach 181 zettabytes. To put that in perspective,one zettabyte equals one trillion gigabytes.
About 402 million terabytes of new data are created every single day. That works out to roughly 2.5 quintillion bytes per day.90% of all the data that has ever existed in human history was created in just the last two years. Data is growing that fast.
- Back in 2010, the total amount of data in the world was just 2 zettabytes.
- By 2020, it had jumped to 64 zettabytes. By 2025, it was expected to hit 181 zettabytes.
That means the data volume roughly doubles every three to four years.
This explosive growth is driven by the internet, social media, smartphones, cloud computing, Internet of Things (IoT) devices, and artificial intelligence.
But it is not just about how much data there is. What matters more is what we do with it.
Companies use data to understand their customers. Hospitals use data to save lives. Governments use data to plan cities and fight crime. Scientists use data to study the climate, map the human genome, and explore the universe.
Data, when used well, has the power to improve almost every part of our lives.
Chapter 2: Types of Data
Not all data is the same. Data comes in many different shapes and forms, and understanding these types is the first step to working with data effectively.
In this section, we will break down the main categories of data, from structured to unstructured, from numbers to words, and everything in between.
Structured vs. Unstructured vs. Semi-Structured Data
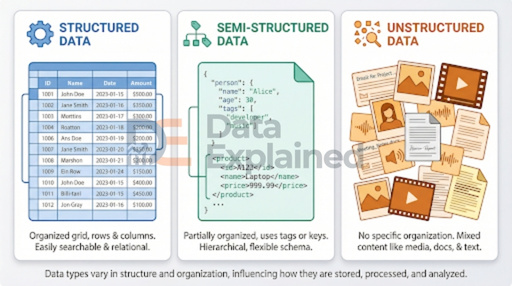
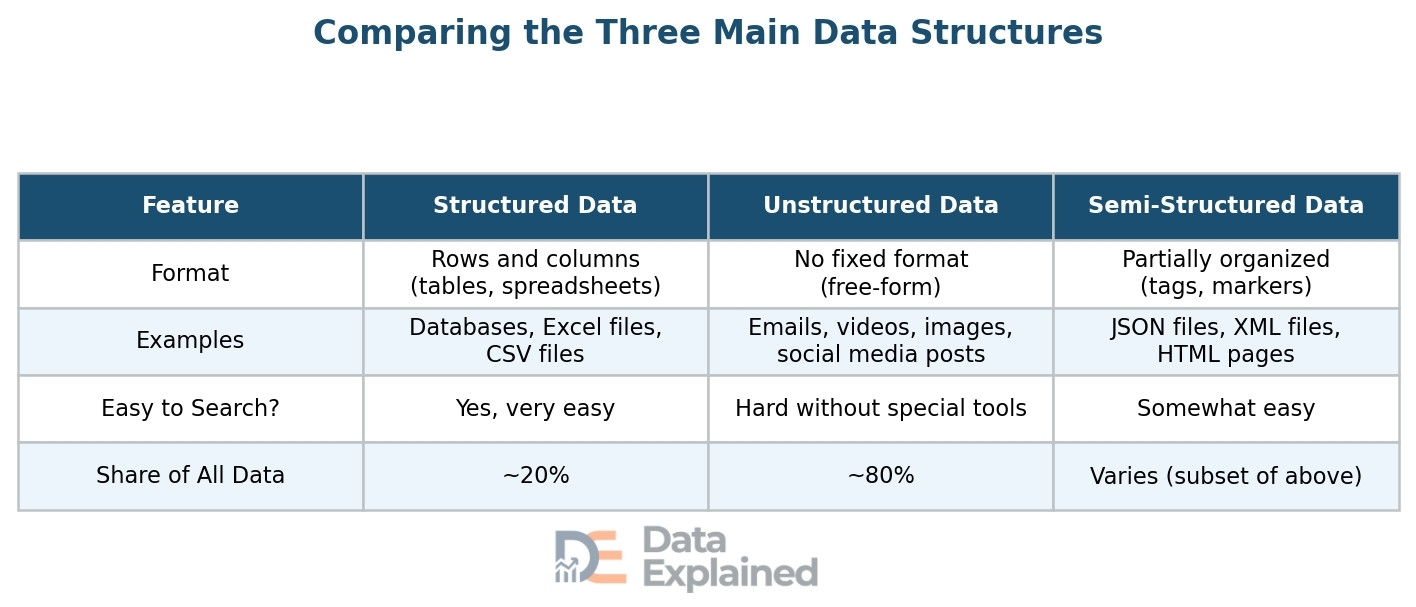
One of the most important ways to classify data is by its organization. This gives us three main categories: structured, unstructured, and semi-structured data.
Structured data is the most organized type. It fits neatly into rows and columns, like a spreadsheet or a database table.
Think of a list of employees with columns for name, job title, salary, and start date. Each piece of information has a specific place.
Structured data is easy to search, sort, and analyze. Examples include bank records, inventory lists, and customer databases.
Unstructured data has no fixed format or organization. It is messy, free-form, and comes in many shapes.
Examples include emails, social media posts, photos, videos, voice recordings, and handwritten notes.
This type of data is much harder to search and analyze because there are no neat rows and columns. However, it makes up the vast majority of all data in the world.
DO YOU KNOW?
About 80% of all data stored worldwide is unstructured. That means only about 20% of the world’s data is neatly organized in tables and databases. The rest is scattered across emails, videos, images, and documents.
Semi-structured data falls somewhere in between. It is not as neatly organized as structured data, but it does have some markers or tags that provide some organization.
Examples include JSON files (commonly used in web applications), XML files, and HTML web pages. An email is a good everyday example: the “To,” “From,” and “Subject” fields are structured, but the email body is unstructured.
Qualitative vs. Quantitative Data
Another important way to sort data is by whether it describes qualities or quantities.
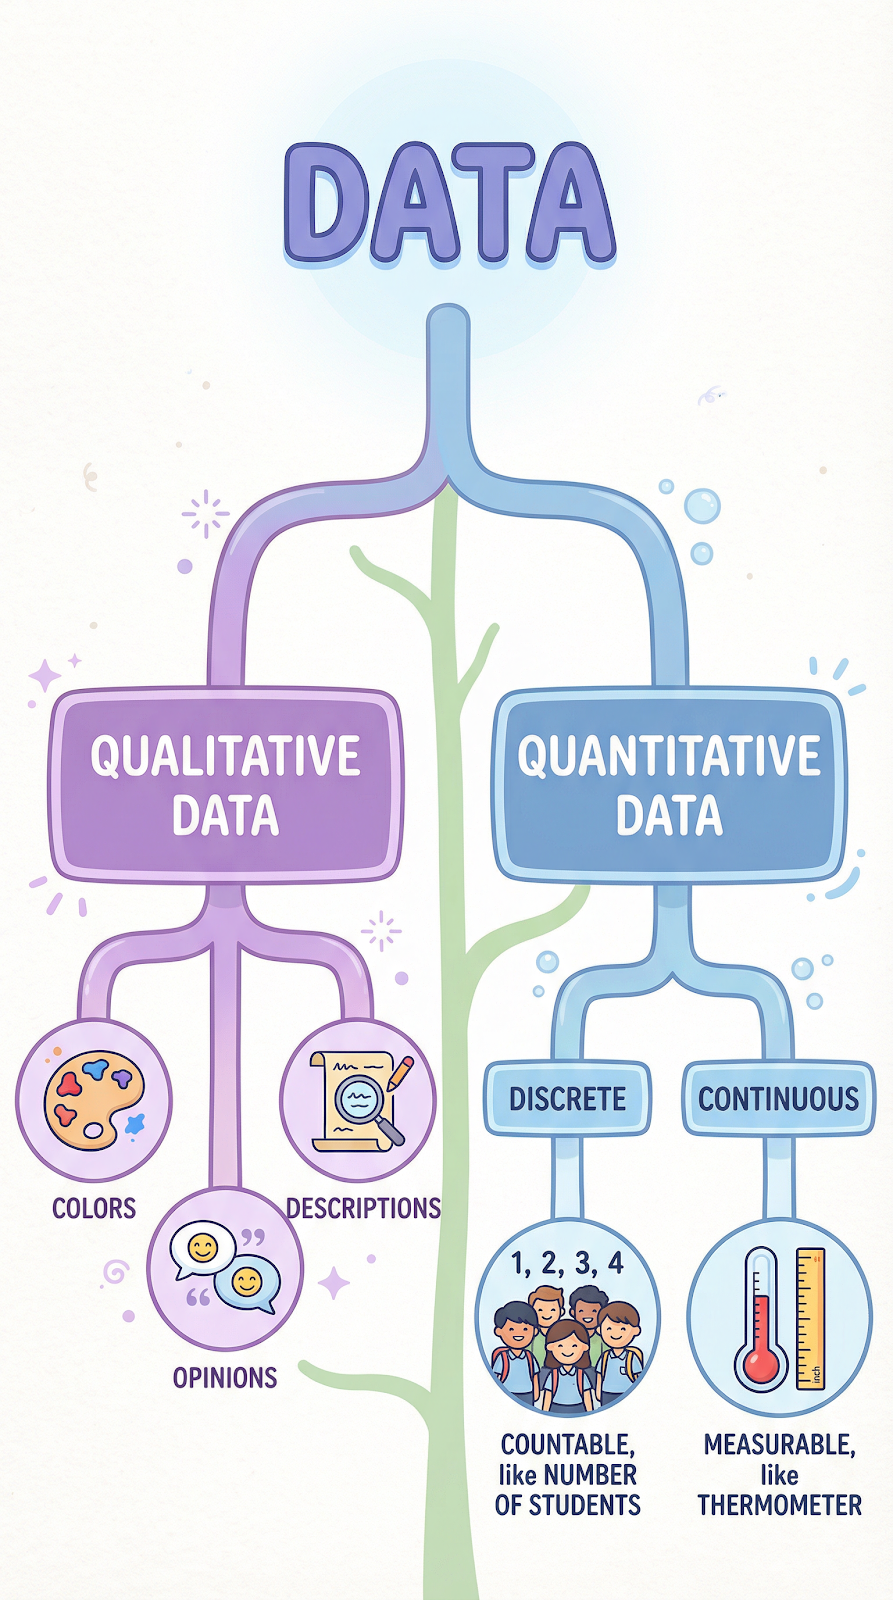
Qualitative data (also called categorical data) describes characteristics, qualities, or properties. It answers questions like “what kind?” or “what type?” Examples include the color of a car, a customer’s opinion about a product, the taste of a food, or the mood of a song. Qualitative data is typically expressed in words rather than numbers.
Quantitative data deals with numbers and measurements. It answers questions like “how many?” or “how much?” Examples include the temperature outside, the number of students in a class, a person’s height, or the price of a stock.
Quantitative data can be further divided into two subtypes:
- Discrete data is data that can only take certain specific values, usually whole numbers. For example, the number of children in a family (you can have 2 or 3 children, but not 2.5).
- Continuous data can take any value within a range. For example, temperature can be 36.5 degrees, 36.57 degrees, or any point in between.
Other Important Data Types
Beyond the big categories above, there are several other data types that are important to understand:
Categorical (Nominal) data: data sorted into groups or categories with no natural order. Examples include blood type (A, B, AB, O), nationality, or phone brand.
Ordinal data: data with a meaningful order or ranking, but the distance between each rank is not equal. Examples include movie ratings (1-5 stars), education level (high school, bachelor’s, master’s), or satisfaction surveys (very unhappy, unhappy, neutral, happy, very happy).
Time-series data: data points collected at regular intervals over time. Examples include daily stock prices, hourly weather readings, or monthly sales figures. Time-series data is crucial for spotting trends and making predictions.
Spatial (Geospatial) data: data tied to a specific location on Earth. Examples include GPS coordinates, map data, satellite images, and location check-ins. This type of data powers everything from Google Maps to climate research.
Metadata: data about data. Metadata describes the properties of other data. For example, when you take a photo, the metadata might include the date, time, camera settings, and GPS coordinates where the photo was taken. When you save a Word document, the metadata might include the author’s name, creation date, and file size.
Real-time data: data that is created, processed, and used almost instantly. Examples include live stock prices, real-time traffic updates, live sports scores, and sensor readings from factory equipment. Real-time data is becoming increasingly important as businesses and systems need to react to events as they occur.
Chapter 3: How Data Is Collected
Before data can be analyzed or used, it must first be gathered.
Data collection is the process of capturing raw facts from the world around us. There are many different methods, ranging from old-fashioned paper surveys to advanced digital sensors that never sleep.
Let us explore both traditional and modern methods.
Traditional Data Collection Methods
Long before the internet existed, people still collected data. Many of these older methods are still used today, often alongside digital tools.
Surveys and questionnaires are one of the oldest and most common methods. A survey is a set of questions given to a group of people to collect their opinions, habits, or facts about their lives. Surveys can be on paper or online. Governments use surveys (like the national census) to count populations. Companies use them to understand what customers want.
Interviews and focus groups involve talking directly to people to gather in-depth information. Interviews are one-on-one, while focus groups bring together a small group to discuss a topic. These methods give detailed, qualitative data that surveys often miss.
Observation and field studies involve watching and recording what happens in a specific setting. A scientist might observe animals in the wild. A traffic engineer might count the number of cars passing through an intersection. This method is great for collecting data about behavior in natural settings.
Government records and census data are massive collections of information gathered by governments. Census data tells us how many people live in a country, their ages, jobs, income levels, and more. This category includes tax records, birth and death certificates, and court records.
Scientific experiments generate data through controlled tests. Researchers change one variable, measure the results, and record the data. This method is the backbone of fields like medicine, chemistry, physics, and biology.
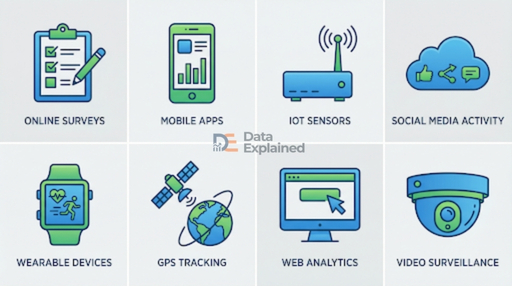
Digital Data Collection Methods
In the modern world, most new data is collected digitally.
Machines, apps, websites, and sensors are constantly gathering information, often without us even realizing it.
Website tracking uses tools like cookies and analytics software to record what people do on websites. Every page you visit, every button you click, and how long you stay on each page creates data. Companies like Google Analytics process billions of these data points every day.
Social media activity is one of the largest sources of data worldwide. Every like, share, comment, post, story, and direct message creates data. With over 5.22 billion social media users worldwide spending an average of 143 minutes per day on platforms, the amount of social media data generated is staggering.
Sensors and IoT devices are devices connected to the internet that collect data automatically. A smart thermostat records temperature data. A fitness tracker records your steps, heart rate, and sleep patterns.
Factory sensors monitor machine performance. City sensors track air quality and traffic flow.
DO YOU KNOW?
- In 2025, there are an estimated 19 billion IoT devices worldwide. By 2026, that number is projected to reach 21 billion. The number of connected devices grew 100 times between 2006 and 2020, from 2 billion to 200 billion.
Mobile apps generate enormous amounts of data. Every time you use a ride-sharing app, order food, stream a song, or play a game, data is being created and collected. Mobile app usage grew by 24.5% between 2022 and 2023, with users spending nearly 16 billion hours on apps.
Transaction records are created every time money changes hands digitally. Credit card purchases, online orders, bank transfers, and digital wallet payments all generate data that is stored, analyzed, and used to detect fraud, understand spending habits, and improve services.
Wearable technology, such as smartwatches, fitness bands, and even smart clothing, generates continuous streams of health and activity data. These devices monitor heart rate, blood oxygen levels, steps, sleep quality, and more, sending data to cloud servers for analysis.
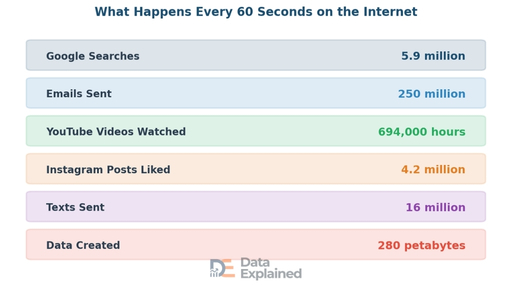
Data Collection at Scale
To truly understand how much data the world creates, it helps to look at what happens in just one minute online.
The numbers are mind-boggling.
Google handles over 13.6 billion to 14 billion searches per day in 2025, which is roughly 5 trillion per year.
Over 250 million emails are sent worldwide every minute. In total, about 361 billion emails are sent each day (as of 2024) globally.
Each internet user generates about 1.7 megabytes of data every second. Video content alone accounts for 53% of all global data traffic.
Global internet bandwidth increased by 22% in 2024, reaching 1,479 terabits per second. Internet traffic at major exchange points has doubled since 2020.
Chapter 4: How Data Is Stored
Once data is collected, it needs to go somewhere.
Data storage is the technology and process of saving data so it can be accessed and used later. Over the decades, the ways we store data have changed dramatically.
In this section, we will look at the history of storage, the modern options available, and how we measure data size.
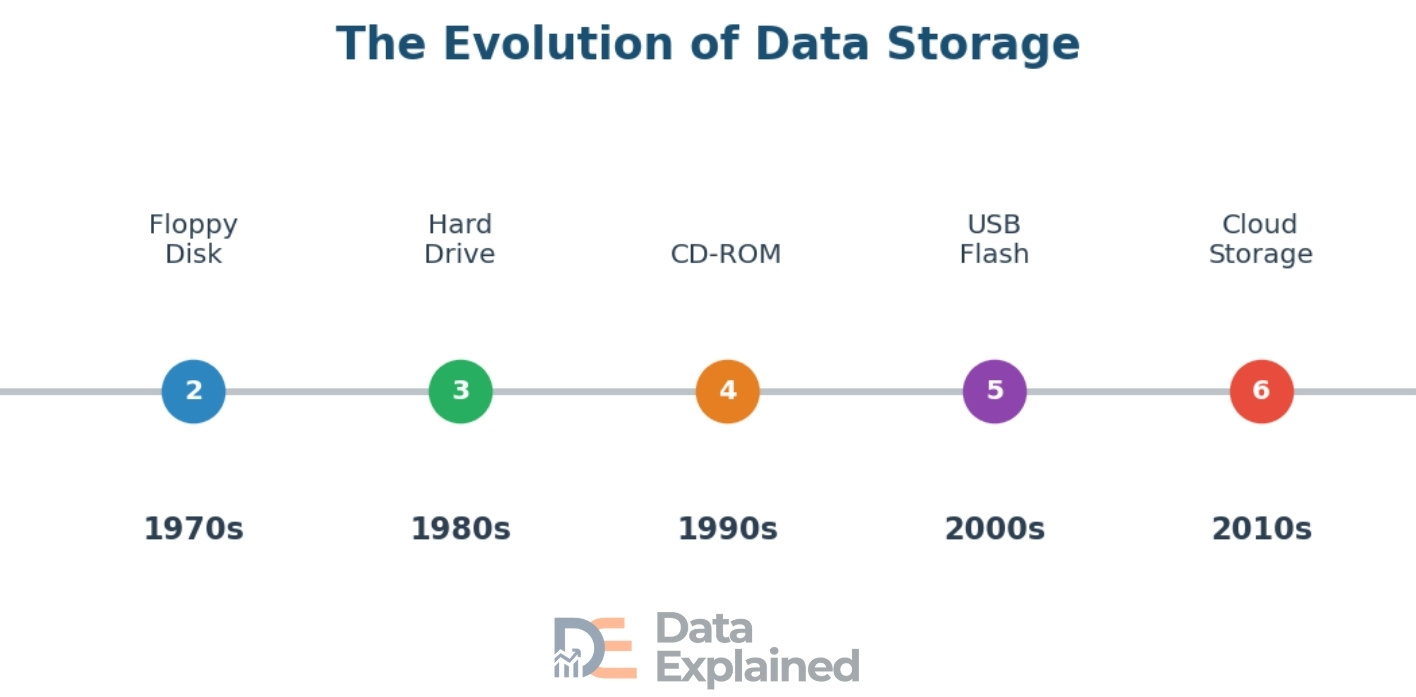
A Quick History of Data Storage
The story of data storage is a story of constant progress.
Each new technology enabled us to store more data in less space, at lower cost, and with faster access speeds.
In the 1950s and 1960s, magnetic tape was the primary way to store computer data. These large reels of tape could hold a few megabytes and were used by governments and large companies. In the 1970s, the floppy disk was introduced.
The first floppy disks were 8 inches wide and held just 80 kilobytes. By the 1980s, smaller 3.5-inch floppy disks could store 1.44 megabytes.
Hard disk drives (HDDs) became common in the 1980s and 1990s, offering much more space. The first commercial hard drive, the IBM 350 in 1956, weighed over a ton and stored just 5 megabytes.
Today, a single hard drive the size of your hand can store 20 terabytes or more.
CDs arrived in the 1980s and could hold about 700 megabytes, while DVDs in the late 1990s could hold 4.7 gigabytes.
USB flash drives appeared around 2000, giving people a tiny, portable way to carry data. The first ones held just 8 megabytes. Modern flash drives can hold 2 terabytes.
But the biggest change in data storage came with cloud computing in the 2010s. Cloud storage means data is kept on remote servers owned by companies like Amazon (AWS), Microsoft (Azure), and Google (Google Cloud), and accessed over the internet.
This shifted the world from storing data locally to storing it “in the cloud.”
Modern Data Storage Options
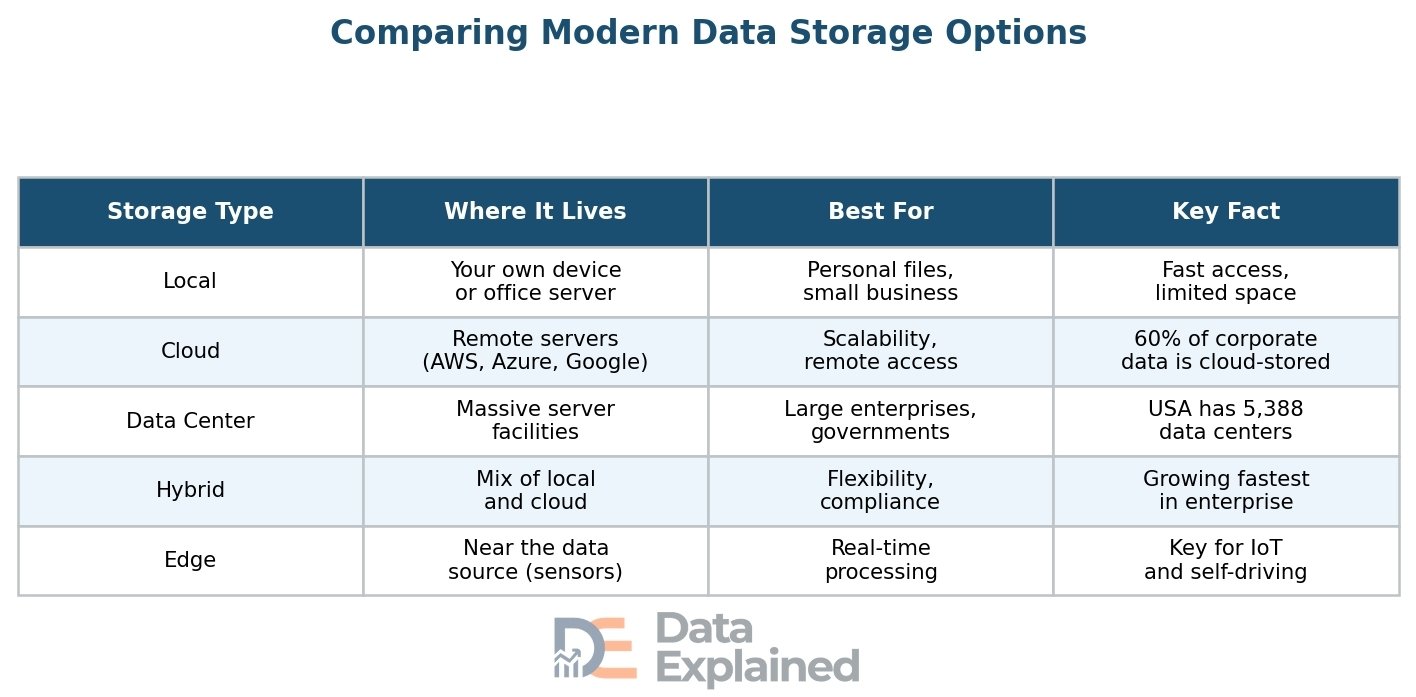
Today, there are five main ways to store data, each with its own strengths and weaknesses.
Local storage means storing data on physical devices you own and control, such as your computer’s hard drive, an external hard drive, or a USB flash drive. The advantage is speed and control. The downside is limited space and the risk of losing data if the device breaks or is stolen.
Cloud storage is the most transformative development in recent years. Instead of saving files on your own device, you save them on remote servers accessed through the internet. Services like Google Drive, Dropbox, iCloud, and OneDrive make cloud storage easy for everyday users.
For businesses, platforms like Amazon Web Services (AWS), Microsoft Azure, and Google Cloud provide massive, scalable storage.
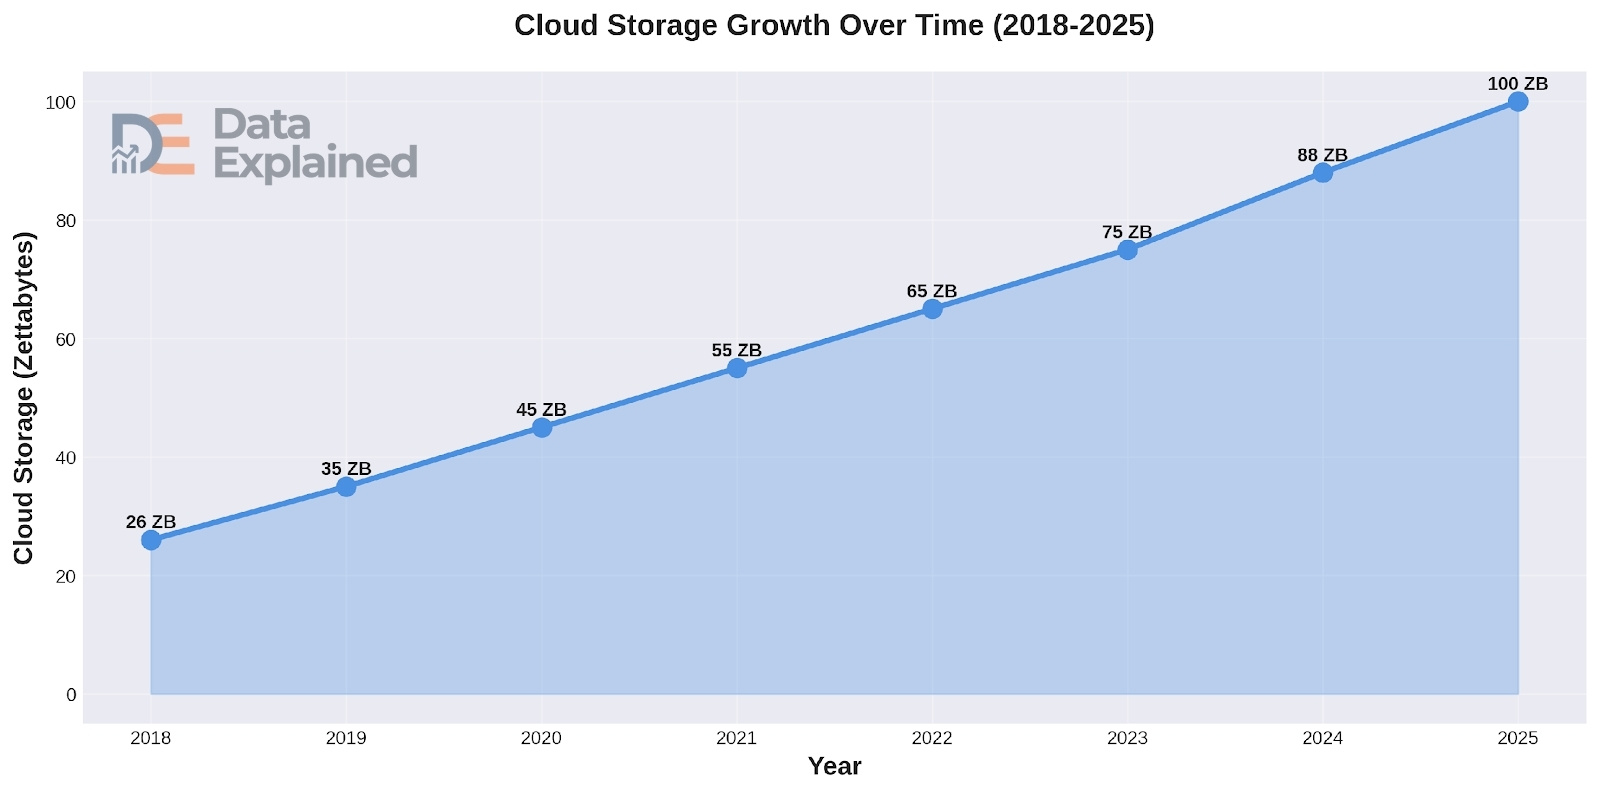
By 2025, about 100 zettabytes of data were projected to be stored in the cloud. That is roughly 50% of all the world’s data, up from about 25% in 2015.
Approximately 60% of all corporate data is now stored in the cloud. About 65% of individuals use personal cloud storage as their main storage method.
Data centers are massive facilities that house thousands of computer servers. They are the backbone of the internet and cloud computing.
Data centers power everything from streaming video to online banking to social media.
The United States leads the world with 5,388 data centers. Germany is second with 522. In 2024, the global data center market was valued at $416 billion and is projected to reach $1,009 billion by 2034, growing at about 11% per year.
Hybrid storage combines local (on-premise) storage with cloud storage. Many businesses use this approach because it gives them the speed of local storage for everyday work and the scalability of the cloud for larger needs.
It also supports compliance, as some data must be stored on local servers due to privacy laws.
Edge storage is a newer concept where data is stored close to where it is created, at the “edge” of the network.
Instead of sending data all the way to a central cloud, it is processed and stored near the source, like in a factory sensor, a self-driving car, or a smart traffic light.
This reduces delays and is critical for applications that need real-time responses.
How Data Is Measured
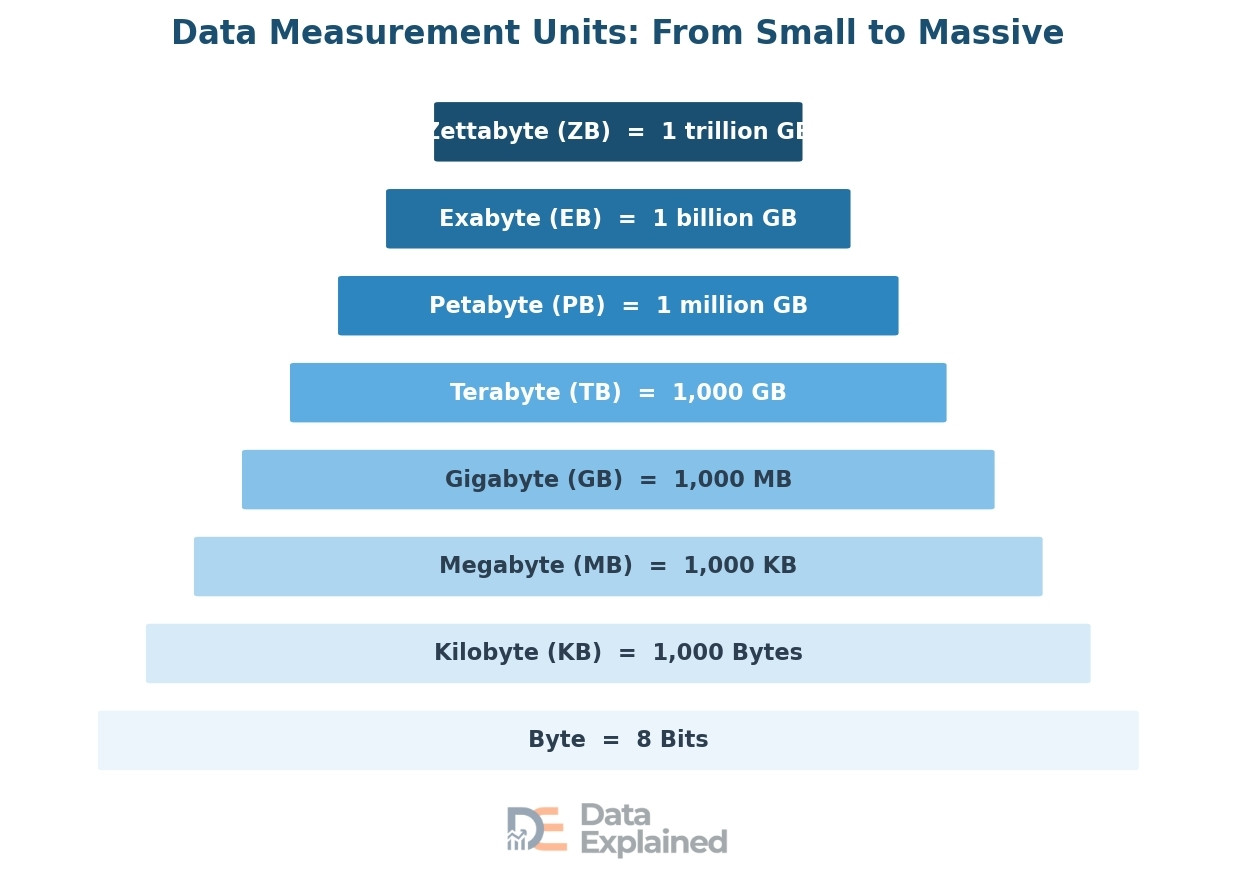
Data is measured in units called bytes, and the system increments by roughly 1,000 (technically 1,024 in computing).
Here is a quick guide to the units, from smallest to largest, with everyday comparisons to help you picture the size:
- A bit is the smallest unit of data, either a 0 or a 1. A byte is 8 bits, enough to represent a single character, such as the letter “A.”
- A kilobyte (KB) is about 1,000 bytes, roughly the size of a short email. A megabyte (MB) is about 1,000 kilobytes, roughly equal to 1 minute of MP3 music.
- A gigabyte (GB) is about 1,000 MB, roughly the size of a full-length movie in standard quality. A terabyte (TB) is about 1,000 GB, enough to store about 500 hours of high-definition video.
Beyond that, a petabyte (PB) is about 1,000 TB; Netflix reportedly stores about 60 petabytes of video content. An exabyte (EB) is about 1,000 PB.
And a zettabyte (ZB) is about 1,000 EB, or one trillion gigabytes. When we say the world created 149 zettabytes of data in 2024, that is 149 trillion gigabytes.
DO YOU KNOW?
- Global storage capacity is expected to grow at a compound annual growth rate (CAGR) of 19.2% from 2020 to 2025. The global data storage market is projected to reach $774 billion by 2032.
Chapter 5: How Data Is Processed and Analyzed
Collecting and storing data is only the beginning. The real value of data comes from what you do with it.
Processing and analyzing data means turning raw facts into useful insights that help people make better decisions.
In this section, we will walk through the data processing cycle, the main types of analysis, the tools used, and the world of Big Data.
The Data Processing Cycle
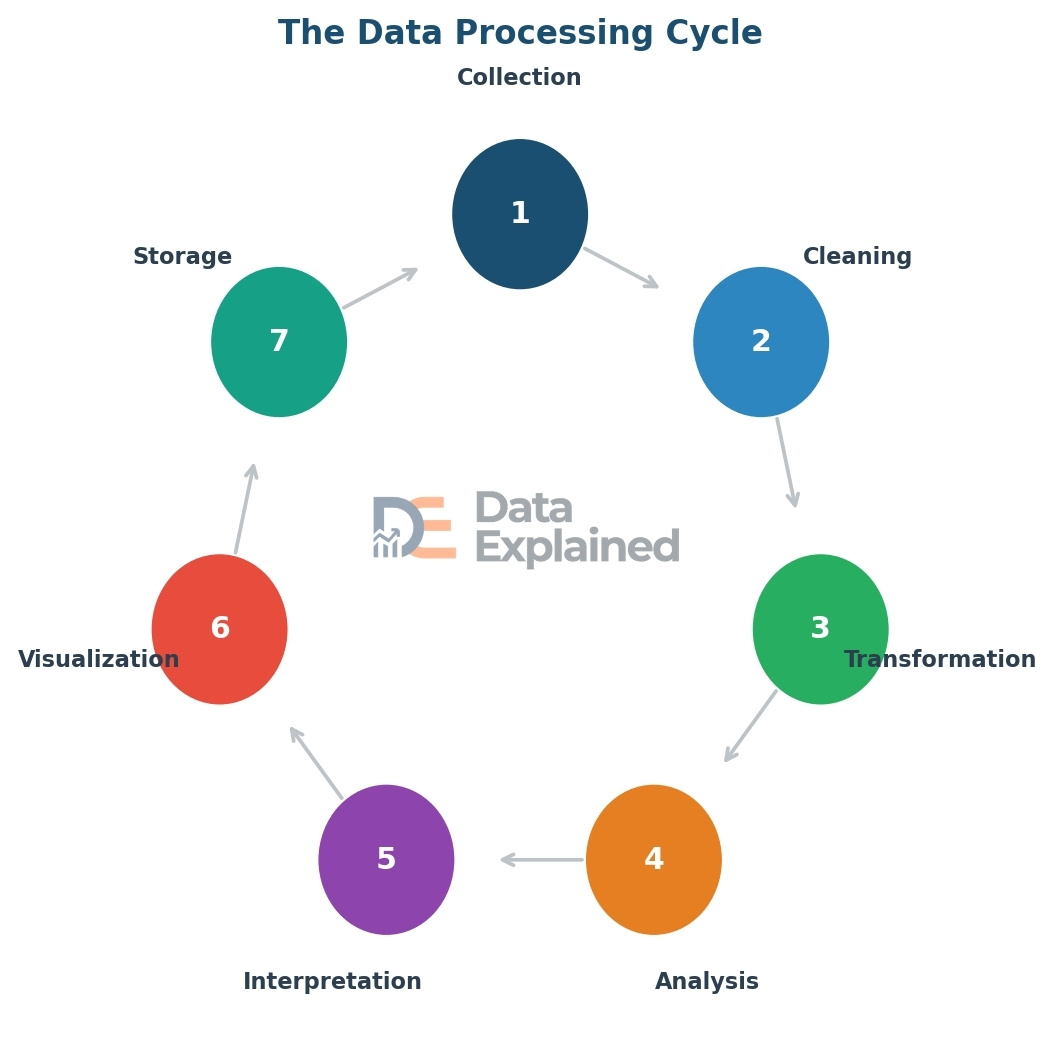
Data processing follows a cycle of steps that take raw data from a messy, unorganized state to useful, actionable insights.
Here are the seven main steps:
Step 1 – Collection: This is where it all starts. Raw data is gathered from its source, whether a survey, sensor, database, website, or other origin.
Step 2 – Cleaning: Raw data is rarely perfect. Cleaning means fixing errors, removing duplicate entries, filling in missing values, and removing data that does not belong. This step is critical because bad data leads to bad conclusions. Data scientists often say that 80% of their time is spent on cleaning data.
Step 3 – Transformation: Once the data is clean, it must be converted to a format suitable for analysis. This might mean changing date formats, merging data from different sources, or converting text into numbers.
Step 4 – Analysis: This is the heart of the process. Analysts and computers examine the data to find patterns, trends, relationships, and insights. This can range from simple calculations (like averages) to complex machine learning models.
Step 5 – Interpretation: Finding a pattern is one thing. Understanding what it means is another. Interpretation is where analysts explain the results in plain language and connect them to real-world decisions.
Step 6 – Visualization: Data is much easier to understand when presented visually. Charts, graphs, maps, and dashboards turn numbers into pictures that anyone can understand at a glance.
Step 7 – Storage and Archiving: After data has been processed and analyzed, the results are stored for future reference. The original data is also archived in case it needs to be re-analyzed later.
Key Methods of Data Analysis
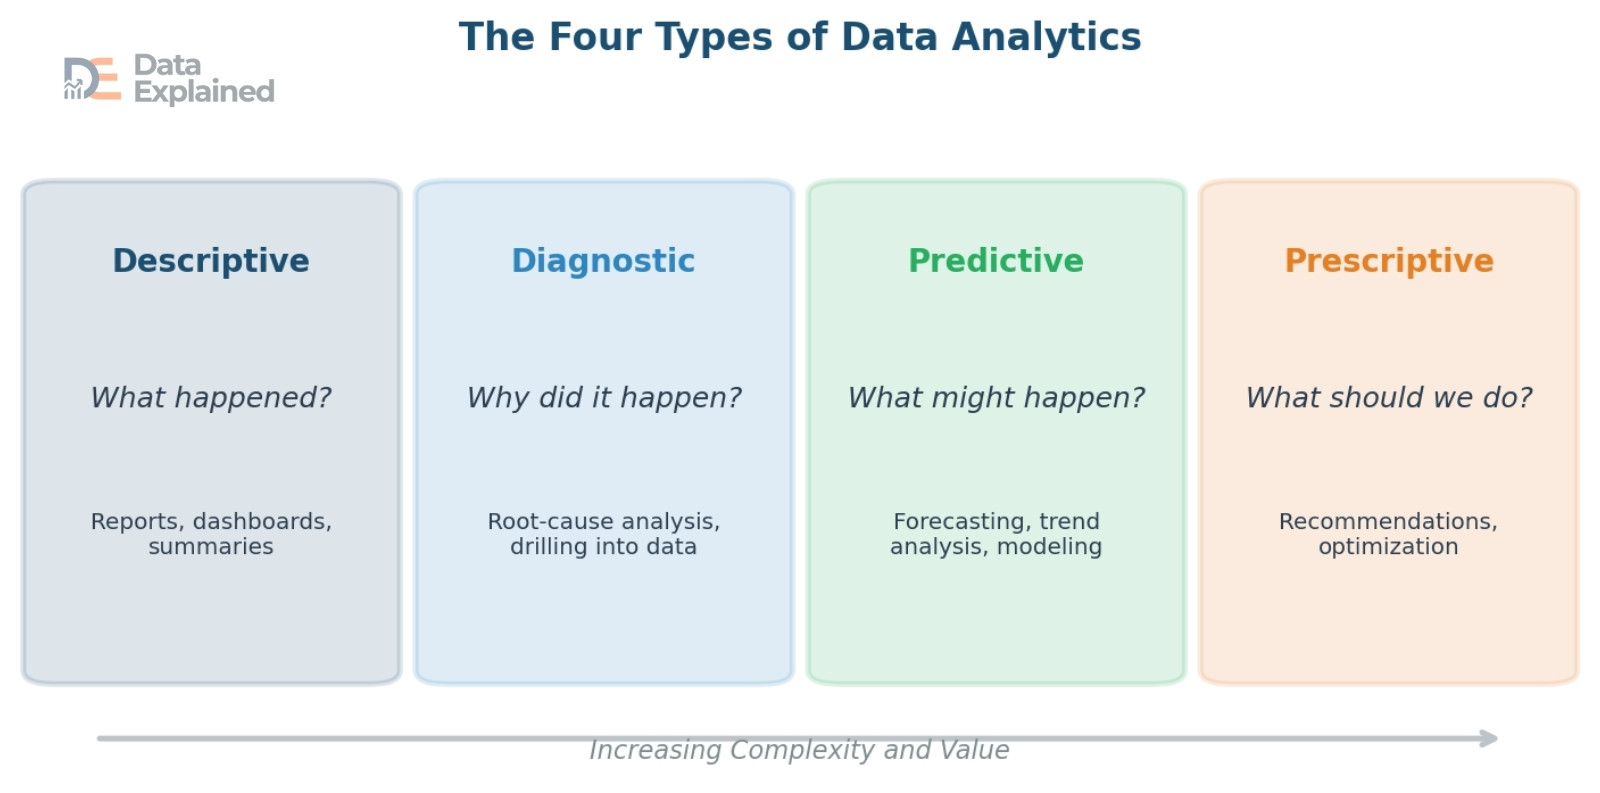
There are four main types of data analysis, each answering a different question.
Think of them as four levels of depth, from looking backward to looking forward.
- Descriptive analytics answers the question: “What happened?” It summarizes past data into reports, dashboards, and charts. For example, a sales report showing last month’s revenue is an example of descriptive analytics. It does not explain why things happened; it simply describes what occurred.
- Diagnostic analytics goes one step deeper and asks: “Why did it happen?” It digs into the data to find the root cause of an event. For example, if sales dropped last month, diagnostic analytics might reveal that a website outage caused the decline.
- Predictive analytics looks forward and asks: “What might happen next?” It uses historical data, statistical models, and machine learning to make forecasts. For example, a weather service predicting tomorrow’s temperature, or a bank predicting which customers are likely to default on a loan.
DO YOU KNOW?
- The global data science and predictive analytics market was valued at about $19 billion in 2024 and is projected to reach $179 billion by 2037, growing at about 18.8% per year.
Prescriptive analytics is the most advanced type. It answers the question: “What should we do about it?” It not only predicts what will happen but also recommends specific actions. For example, a logistics company might use prescriptive analytics to find the fastest delivery route based on traffic, weather, and driver availability.
Tools and Technologies for Data Analysis
A wide variety of tools are used to analyze data, from simple ones that almost everyone has used to advanced platforms designed for data scientists and engineers.
Spreadsheets like Microsoft Excel and Google Sheets are the most widely used data tools in the world. They are great for organizing, sorting, filtering, and performing basic calculations on small to medium datasets.
Databases and SQL (Structured Query Language) are used to store and retrieve large amounts of structured data.
SQL is a programming language specifically designed for querying databases.
Programming languages like Python and R are the workhorses of modern data science.
- Python is especially popular because it is easy to learn and has powerful libraries for data analysis (such as Pandas), machine learning (such as Scikit-learn), and visualization (such as Matplotlib). R is widely used in statistics and academic research.
- Business Intelligence (BI) tools like Tableau, Power BI, and Looker help people create interactive dashboards and visual reports without writing code.
These tools are widely used in companies of all sizes to make data accessible to non-technical employees.
Cloud-based platforms such as Amazon Web Services (AWS), Google Cloud Platform (GCP), Microsoft Azure, and Databricks provide the computing power and storage needed to process massive datasets.
Databricks crossed $3 billion in annual revenue in 2024, showing how fast demand for these platforms is growing.
The Rise of Big Data
When data sets become so large and complex that traditional tools like spreadsheets cannot handle them, we enter the world of Big Data.
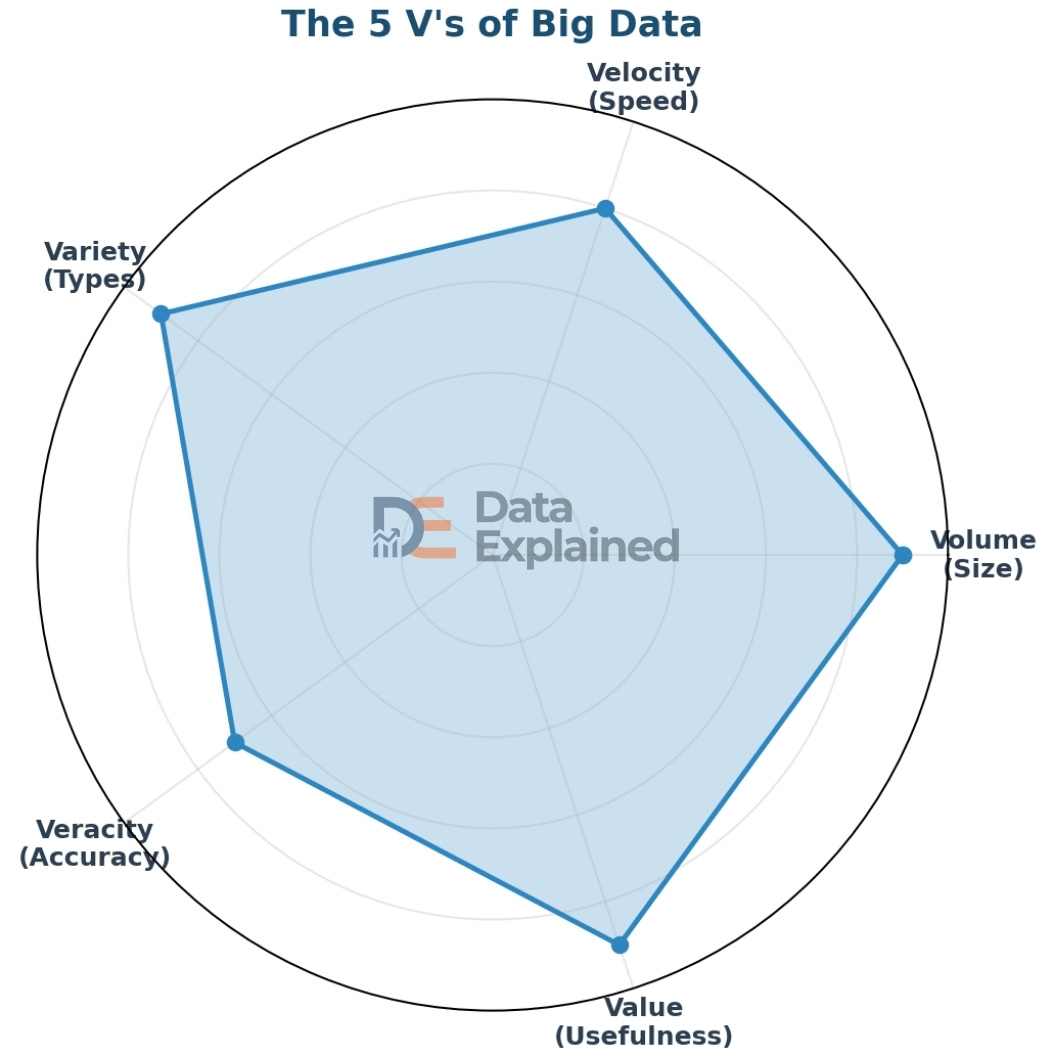
Big Data is not just about size. It is defined by five characteristics, often called the “5 V’s”:
- Volume: The sheer amount of data. We are talking about petabytes, exabytes, and zettabytes of information.
- Velocity: The speed at which data is created and needs to be processed. Social media posts, stock trades, and sensor readings are generated in real time.
- Variety: Data comes in many formats: text, numbers, images, video, audio, sensor readings, and more.
- Veracity: The trustworthiness and accuracy of the data. Not all data is reliable, and cleaning and validating data is a constant challenge.
- Value: The usefulness of the data. Data is only valuable if you can extract meaningful insights from it.
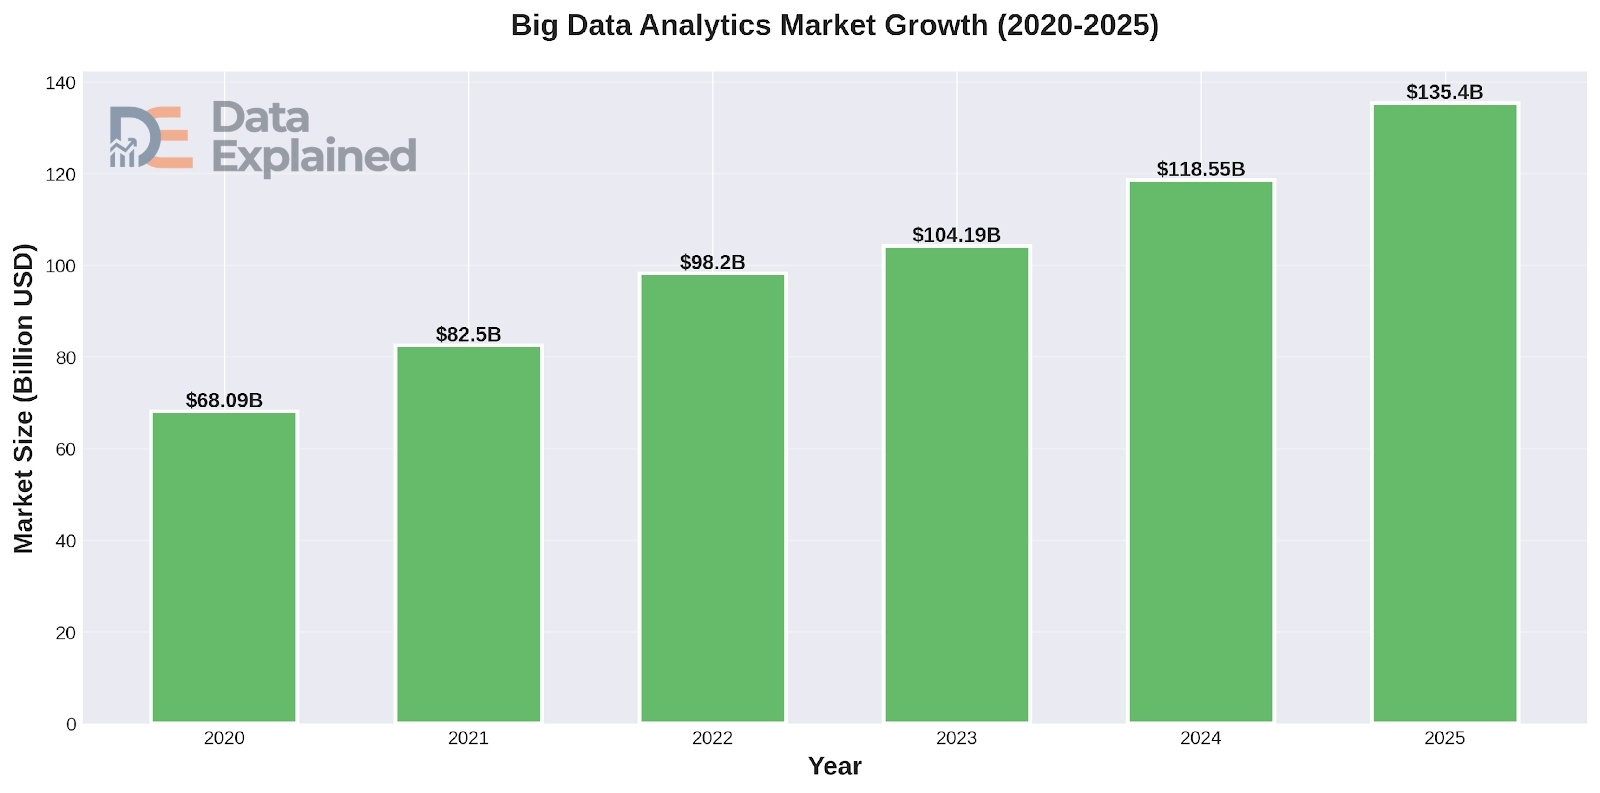
The global Big Data and business analytics market is expected to grow by $1.51 trillion between 2025 and 2037, at a compound annual growth rate of about 15.2%. The Big Data as a Service market reached $61.8 billion by 2024, growing at a 33.1% annual rate. Over 90% of organizations are already using Big Data to drive business decisions. Yet 95% of businesses say managing unstructured data remains a significant problem.
Chapter 6: Data Science and Artificial Intelligence
Data science and artificial intelligence (AI) are two of the most talked-about fields in the modern world, and they are deeply connected to data.
In this section, we will explain what data science is, how AI depends on data, and how the two work together in real life.
What Is Data Science?
Data science is a field that combines mathematics, statistics, computer programming, and domain knowledge to derive useful insights from data.
A data scientist’s job is to collect large amounts of data, clean it up, explore it, build models to find patterns, and then explain what those patterns mean in plain language so that decision-makers can act on them.
Data science has become one of the fastest-growing career fields worldwide.
Companies across nearly every industry are hiring data scientists to better understand their customers, improve their products, reduce costs, and stay competitive.
The global data science platform market was valued at about $160 to $175 billion in 2024-2025. It is projected to grow to somewhere between $676 billion and $975 billion by the early 2030s, depending on the source. That is a growth rate of roughly 16% to 21% per year. North America holds about 35% to 40% of the global data science market share. Over 70% of Fortune 500 companies have already adopted data science platforms.
The Connection Between Data and AI
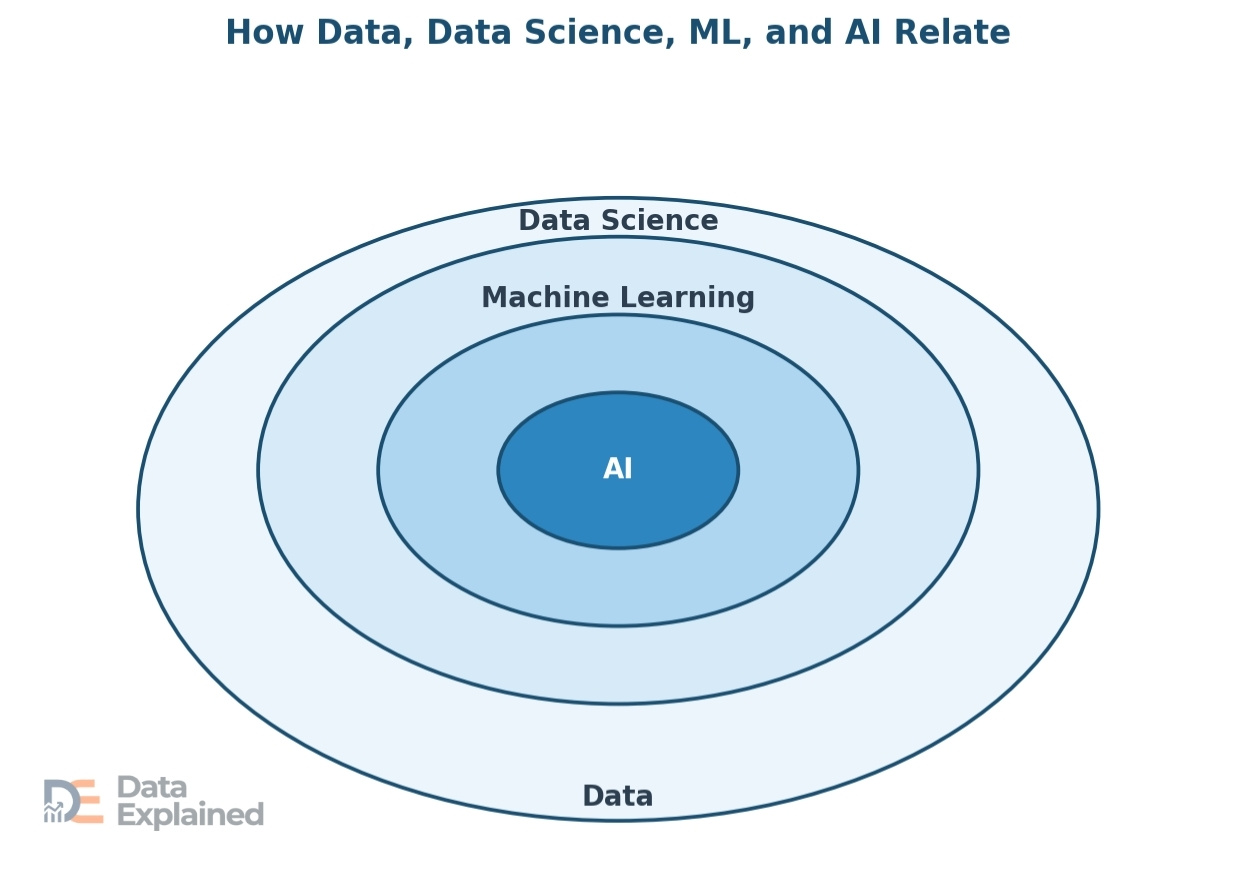
AI is the ability of a computer system to perform tasks that normally require human intelligence, such as recognizing speech, identifying objects in photos, making decisions, and understanding language.
But AI cannot work without data. Data is to AI what fuel is to a car. Without large amounts of high-quality data, AI systems cannot learn, improve, or function.
Machine learning (ML) is the most common branch of AI. It works by feeding large amounts of data into algorithms, which are mathematical models.
The algorithm studies the data, finds patterns, and uses those patterns to make predictions or decisions. For example, a machine learning model trained on thousands of pictures of cats and dogs will learn to distinguish between the two.
Deep learning is a more advanced type of machine learning that uses layers of algorithms called neural networks.
These are inspired by the way the human brain works. Deep learning powers technologies such as voice assistants (Siri, Alexa), self-driving cars, and advanced medical imaging.
Generative AI is a newer category that includes systems like ChatGPT. These models are trained on enormous amounts of text, image, or audio data and can generate new content that looks, sounds, or reads like it was created by a human.
The amount of data used to train these models is staggering, often measured in trillions of words or billions of images.
DO YOU KNOW?
- More than 90% of organizations worldwide are currently investing in AI and Big Data. Organizations that use AI-powered security systems can detect and contain data breaches 80 days faster than those that do not.
Real-World Examples of Data and AI
The combination of data and AI is already changing the world in big and small ways. Here are some of the most impactful examples:
Recommendation engines are used by Netflix, Spotify, Amazon, and YouTube to suggest content you might like. These systems analyze your viewing, listening, or purchasing history (your data) and compare it with millions of other users to predict what you will enjoy next.
Self-driving cars use data from cameras, radar, lidar sensors, and GPS to navigate roads in real time. A single self-driving car can generate about 4 terabytes of data per day. AI processes this data instantly to make split-second driving decisions.
In healthcare, AI systems analyze medical images such as X-rays, CT scans, and MRIs to help doctors detect diseases like cancer earlier and more accurately. AI is also used to speed up drug discovery by analyzing billions of molecular combinations.
Banks and financial institutions use AI to detect fraud by analyzing transaction data in real time. If a credit card transaction looks unusual compared to your normal spending patterns, AI can flag it and block it within milliseconds.
Weather forecasting has been transformed by AI and data. Modern weather models process data from satellites, ground stations, ocean buoys, and aircraft to produce forecasts that are far more accurate than those of even a decade ago.
Chapter 7: Data in Different Fields and Industries
Data is not just a technology topic.
It touches every part of human life, from the hospitals where we receive treatment to the schools where we learn, to the governments that serve us, to the scientists who explore the unknown.
In this section, we will take a detailed look at how data is used across five major areas.
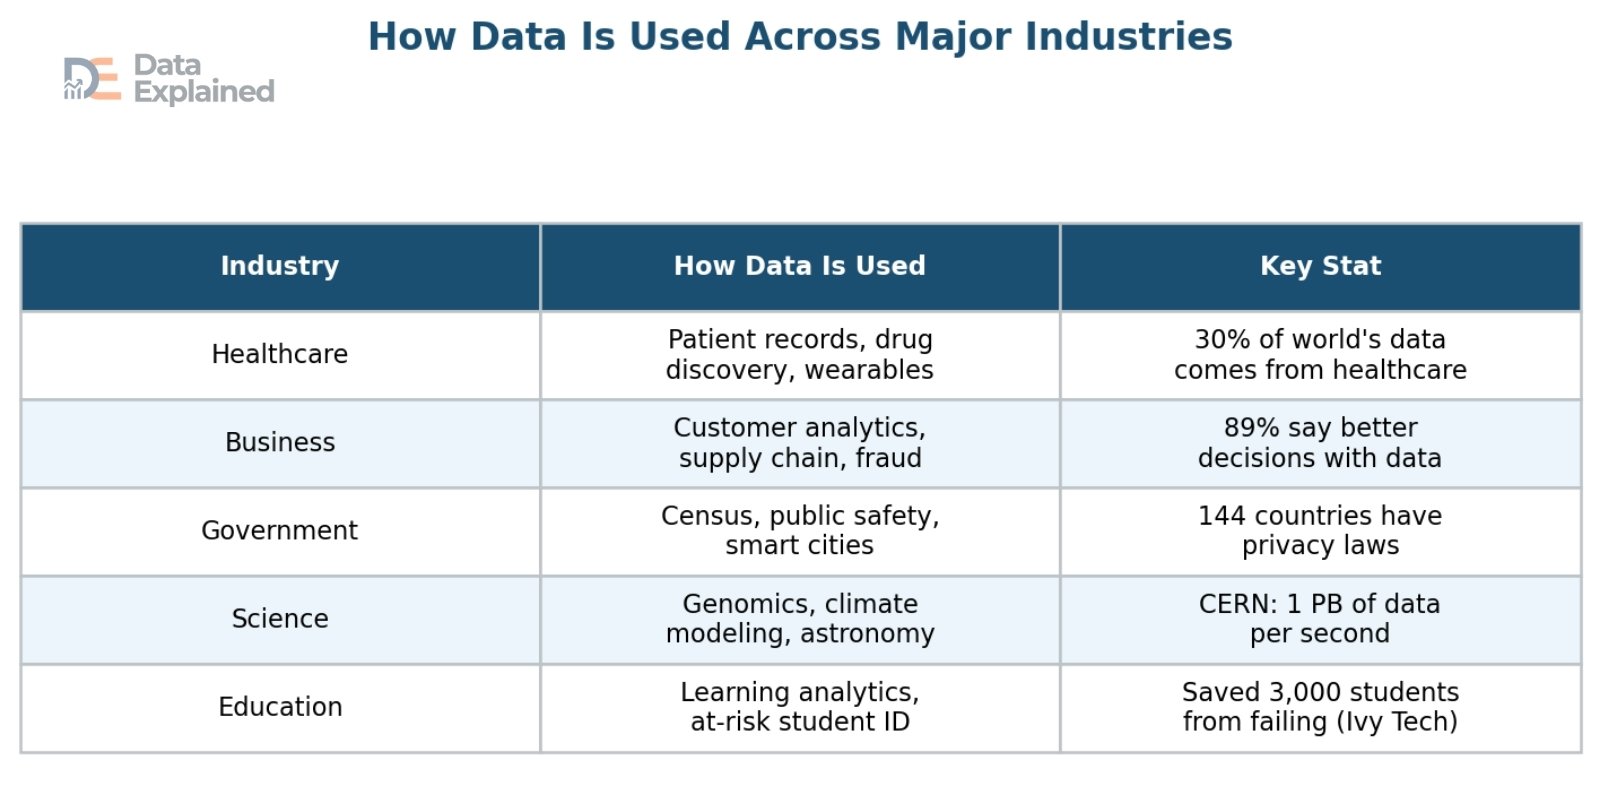
Data in Healthcare
Healthcare is one of the largest generators and users of data worldwide. Every patient visit, lab test, prescription, medical image, and insurance claim creates data.
This data is used to improve patient care, discover new treatments, track the spread of diseases, and manage the business side of healthcare.
Electronic Health Records (EHRs) are digital versions of a patient’s medical history. They include diagnoses, medications, test results, treatment plans, immunization records, allergies, and more.
EHRs allow doctors and nurses to quickly access a patient’s full medical history, reducing errors and improving care.
About 30% of the entire world’s data volume comes from the healthcare industry. The growth rate of healthcare data is expected to reach 36% annually by 2025. That is 6% faster than manufacturing and 10% faster than financial services. Big Data analytics spending in healthcare could reach $79.23 billion by 2028. Total U.S. healthcare spending reached $4.87 trillion in 2023 and is projected to grow 8.2% in 2024.
Wearable health devices, such as smartwatches and fitness trackers, generate continuous health data, including heart rate, blood oxygen levels, sleep patterns, and physical activity.
This data can alert users and their doctors to potential health problems before they become serious.
During the COVID-19 pandemic, data played a critical role. Governments and health organizations used data to track the virus’s spread, model the impact of interventions (such as lockdowns and mask mandates), allocate vaccines, and monitor hospital capacity in real time.
This experience showed the world just how important health data infrastructure is.
Data in Business and Finance
In the business world, data has become the foundation of nearly every decision.
From small startups to giant corporations, companies use data to understand their customers, optimize their operations, predict market trends, and gain a competitive edge.
Customer behavior analysis is one of the biggest uses of data in business.
Companies track which products customers view, how long they browse, what they add to their shopping carts, what they buy, and what they return.
This data helps businesses personalize their marketing, recommend products, set prices, and design better experiences.
DO YOU KNOW?
- 89% of businesses with a well-developed Big Data strategy report that they make better decisions as a result. 87% say their customers are happier after adopting data-driven strategies.
- Companies using Big Data analytics have cut their maintenance costs by up to 30%. Insight-driven businesses are likely to achieve 8.5 times more growth than beginners, with 20% higher revenue growth.
In finance, data is used for risk assessment, fraud detection, algorithmic trading, and regulatory compliance.
Banks analyze transaction data to detect suspicious activity in real time. Insurance companies use data to assess risk and set premiums.
Investment firms use machine learning models to analyze market data and make trading decisions in fractions of a second.
The retail Big Data market is expected to reach $7.73 billion by 2025. Big Data analytics in the banking sector is expected to reach $10.56 billion by 2025.
Data in Government and Public Policy
Governments are among the largest collectors and users of data worldwide.
Data helps governments serve their citizens, plan for the future, enforce laws, and manage public resources efficiently.
Census data is one of the most important data collection efforts any government conducts. It counts the population and gathers information about demographics, housing, education, employment, and more.
This data is used to allocate funding, draw voting district boundaries, and plan for schools, roads, and hospitals.
Public safety agencies use data for crime analysis and prevention.
By analyzing patterns in crime data, police departments can identify high-risk areas and times, allocate officers more effectively, and even predict where crimes are likely to occur.
This approach, known as predictive policing, is powerful but also raises ethical questions about fairness and bias.
Smart city projects use data from sensors, cameras, GPS, and IoT devices to manage urban life more efficiently. Data can be used to optimize traffic flow, reduce energy consumption, manage water systems, improve public transportation, and monitor air quality.
Cities like Singapore, Barcelona, and Dubai are leading the way in the use of smart city data.
Open data initiatives involve governments making public data sets freely available for anyone to use.
This transparency promotes accountability, helps researchers, and fuels innovation. Many countries now have open data portals where citizens can access data on everything from government spending to public health statistics.
DO YOU KNOW?
- As of the end of 2024, 144 countries have data protection and privacy laws in effect, up from 120 in 2017. 68% of public sector organizations say data privacy is a major challenge.
Data in Scientific Research
Science has always been driven by data.
From Galileo’s observations of the stars to the Human Genome Project, collecting and analyzing data is central to the scientific method.
But the scale of data in modern science has reached levels unimaginable just a few decades ago.
In astronomy, telescopes like the James Webb Space Telescope (JWST) generate massive data sets. JWST alone produces about 57 gigabytes of data per day. Ground-based observatories like the upcoming Vera C.
The Rubin Observatory is expected to generate about 20 terabytes of data per night when it comes online.
In genomics and biology, data are central to our understanding of life itself.
The original Human Genome Project took 13 years and generated about 200 gigabytes of data. Today, modern DNA sequencing machines can sequence an entire genome in hours, generating terabytes of data per run.
This data is used to study genetic diseases, develop personalized medicine, and understand human evolution.
In physics, the Large Hadron Collider (LHC) at CERN, the world’s largest and most powerful particle accelerator, produces about 1 petabyte of data per second during experiments.
Only a tiny fraction of this can be stored. Sophisticated algorithms filter the data in real time to capture the most important events.
In climate science, data from satellites, weather stations, ocean buoys, and ice cores is used to monitor global temperatures, track ice melt, measure sea levels, and model future climate scenarios.
This data is critical for understanding climate change and informing policy decisions.
Data in Social Sciences and Education
Data is also transforming how we learn, teach, and understand human society.
In education, learning analytics uses data to track student performance, identify struggling students, personalize learning experiences, and improve teaching methods.
DO YOU KNOW?
- Ivy Tech Community College used data science to extract useful data from 10,000 course sections. They identified 16,000 students at risk of failing and reached out to them. The result: 3,000 students were saved from failing the semester, and 98% of those contacted earned at least a C.
In the social sciences, data is used for survey research, public opinion polling, behavioral analysis, and social network analysis.
Researchers study data from social media platforms, government surveys, and other sources to understand trends in society, including political opinions, health behaviors, and economic inequality.
Chapter 8: Data Privacy and Protection
As data has become more valuable, the question of who controls it, who can access it, and how it is used has become one of the most important issues of our time.
Data privacy is about individuals’ right to decide how their personal information is collected, used, and shared. In this section, we will explore what data privacy means, the major data privacy laws worldwide, and the new challenges posed by AI.
What Is Data Privacy?
Data privacy is the idea that people should have control over their own personal information.
Personal data includes anything that can identify a person, such as their name, home address, phone number, email address, date of birth, Social Security number, health records, financial information, and even their browsing history and location data.
Sensitive data is a special category of personal data that requires even greater protection.
This includes biometric data (fingerprints, facial recognition), genetic and health data, financial records, data about children, and data about race, religion, or political beliefs.
When sensitive data is exposed or misused, the harm to individuals can be severe, ranging from identity theft to discrimination.
The core idea behind data privacy is simple: your data belongs to you.
Companies and governments that collect it should be transparent about what they collect, why, how they will use it, and how they will protect it.
You should have the right to see your data, correct it, and, in many cases, request its deletion.
Major Data Privacy Laws Around the World
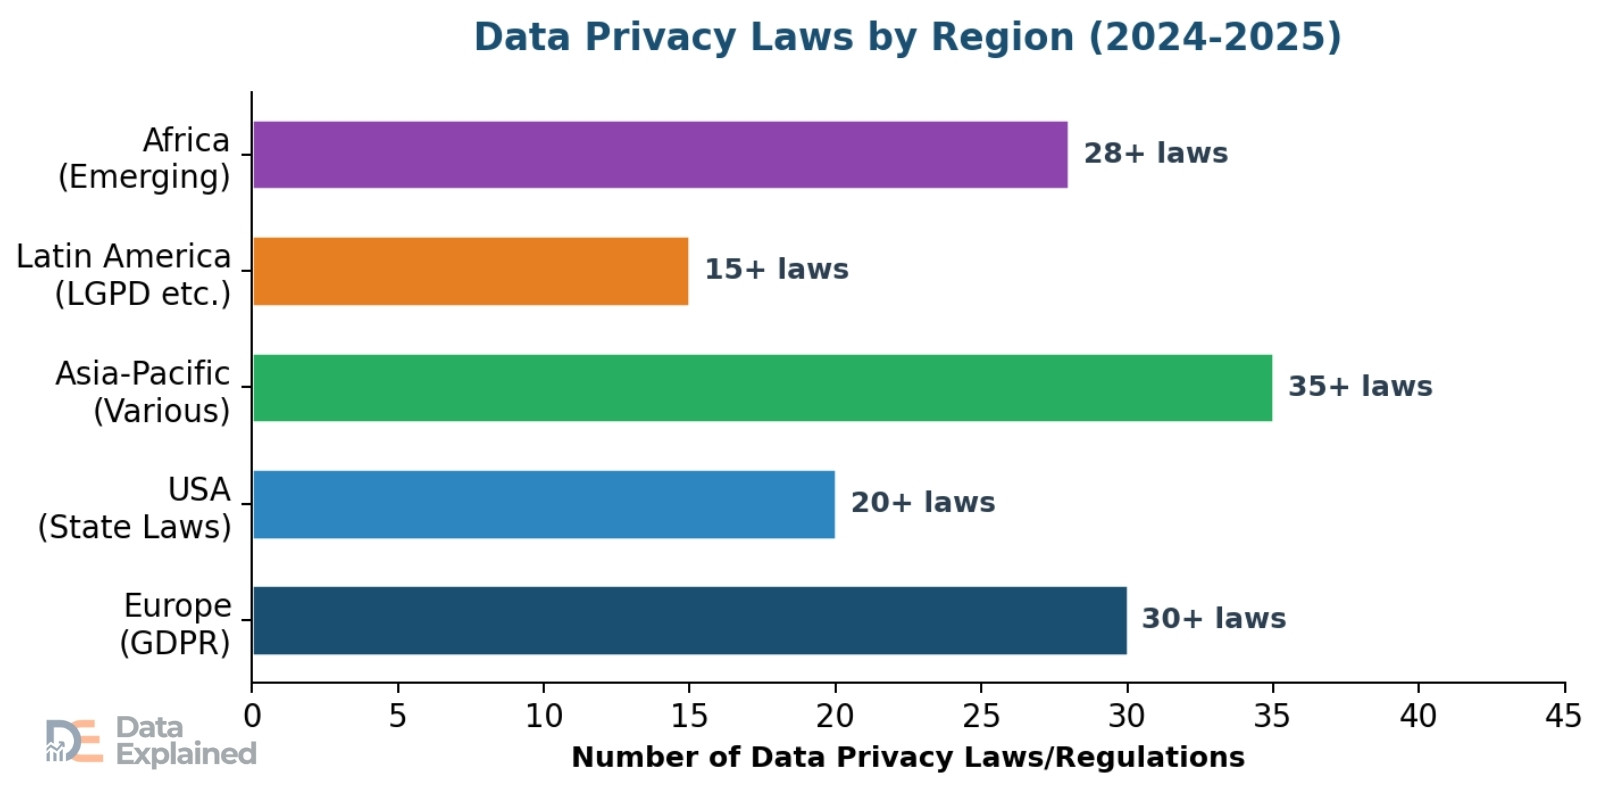
In response to growing concerns about data misuse, countries around the world have passed laws to protect people’s personal information.
The pace of new legislation has been accelerating rapidly.
DO YOU KNOW?
- Over 170 countries have now enacted some form of data privacy regulation. The number of countries with active privacy laws grew from 120 in 2017 to 144 by the end of 2024. Sweden was the first country to pass a national data privacy law (Datalagen) in 1973.
GDPR (General Data Protection Regulation): The European Union’s GDPR, which took effect in May 2018, is widely considered the gold standard of data privacy laws.
It gives EU residents strong rights over their data, including the right to access, correct, and delete their information. It requires companies to get clear consent before collecting data and to report data breaches within 72 hours.
Since May 2018, Europe has issued about 2,245 GDPR fines totaling approximately 5.65 billion euros. In 2025 alone, GDPR penalties reached 2.3 billion euros, a 38% increase from the previous year. Ireland has issued the most in cumulative fines, driven by large penalties against Meta and LinkedIn.
CCPA/CPRA (California, USA): California leads U.S. data privacy efforts with the California Consumer Privacy Act (CCPA), later strengthened by the California Privacy Rights Act (CPRA). These laws give California residents the right to know what data is collected about them, to delete it, and to opt out of its sale.
Other notable laws: Brazil’s LGPD (Lei Geral de Proteção de Dados), India’s Digital Personal Data Protection Act (enforcement began in 2025), China’s PIPL (Personal Information Protection Law), and many more. In 2024 alone, new privacy laws were introduced in countries including Cameroon, Ethiopia, Malawi, Moldova, and even Vatican City.
The United States remains notable for the absence of a single, comprehensive federal privacy law. Instead, it relies on a patchwork of state-level laws. As of 2025, more than 20 states have enacted comprehensive privacy laws.
The proposed federal American Privacy Rights Act (APRA) made no progress in 2024.
75% of the most-visited websites in the United States and Europe are not fully compliant with the GDPR and CPRA, according to recent research.
Key Data Privacy Concepts
Several important ideas form the foundation of modern data privacy laws:
- Consent: Companies must get clear, informed permission from people before collecting their data. This means no hidden tracking, no confusing fine print, and no pre-checked boxes.
- Right to be forgotten: People can ask companies to permanently delete their personal data. This right is enshrined in the GDPR and several other laws.
- Data portability: People have the right to transfer their data from one service to another. For example, you should be able to download all your data from one social media platform and import it into another.
- Data minimization: Companies should only collect the data they truly need for a specific purpose. Collecting extra data “just in case” is discouraged or prohibited.
- Transparency: Companies must clearly explain what data they collect, why, how it will be used, with whom it will be shared, and for how long it will be kept.
The Rise of AI and New Privacy Challenges
The rapid growth of AI has created entirely new privacy challenges. AI systems are often trained on large datasets that may include personal information.
Questions about consent, ownership, and fairness are becoming more urgent.
DO YOU KNOW?
- The EU AI Act, which took effect in August 2024, is the world’s first comprehensive law governing artificial intelligence. It classifies AI systems by risk level and imposes strict requirements on high-risk systems. Enforcement of its initial requirements began in February 2025.
Biometric data, including facial recognition, fingerprint scanning, and voice recognition, is a growing area of concern.
Some cities and countries have banned or restricted the use of facial recognition technology in public spaces.
Even more cutting-edge is the concept of “neurodata,” which is data generated from brain activity. Chile and Peru have become the first countries in the world to legally define neurodata as sensitive personal data requiring the highest level of protection.
The Consent Management Platform market is projected to grow from about $803 million in 2025 to $3.59 billion by 2033, driven by the growing need for tools to properly manage user consent.
Chapter 9: Data Security and Breaches
While Data privacy concerns who can see and use your data, Data security protects your data from unauthorized access, theft, corruption, and loss.
Unfortunately, data breaches, in which sensitive data is exposed to unauthorized parties, are becoming more frequent and more costly.
In this section, we will look at the scale of the problem and the ways organizations fight back.
What Is Data Security?
Data security is the set of practices, tools, and technologies used to protect data from unauthorized access, accidental loss, or intentional destruction.
It covers the entire data lifecycle, from creation to deletion.
The main goals of data security are often described as the “CIA triad”: Confidentiality (only authorized people can see the data), Integrity (the data is accurate and has not been tampered with), and Availability (the data is accessible when needed).
Achieving all three simultaneously is an ongoing challenge for every organization.
The Scale of Data Breaches
Data breaches are one of the most serious threats in the digital world.
A breach can expose the personal information of millions of people, damage a company’s reputation, result in massive financial penalties, and take months or even years to fully resolve.
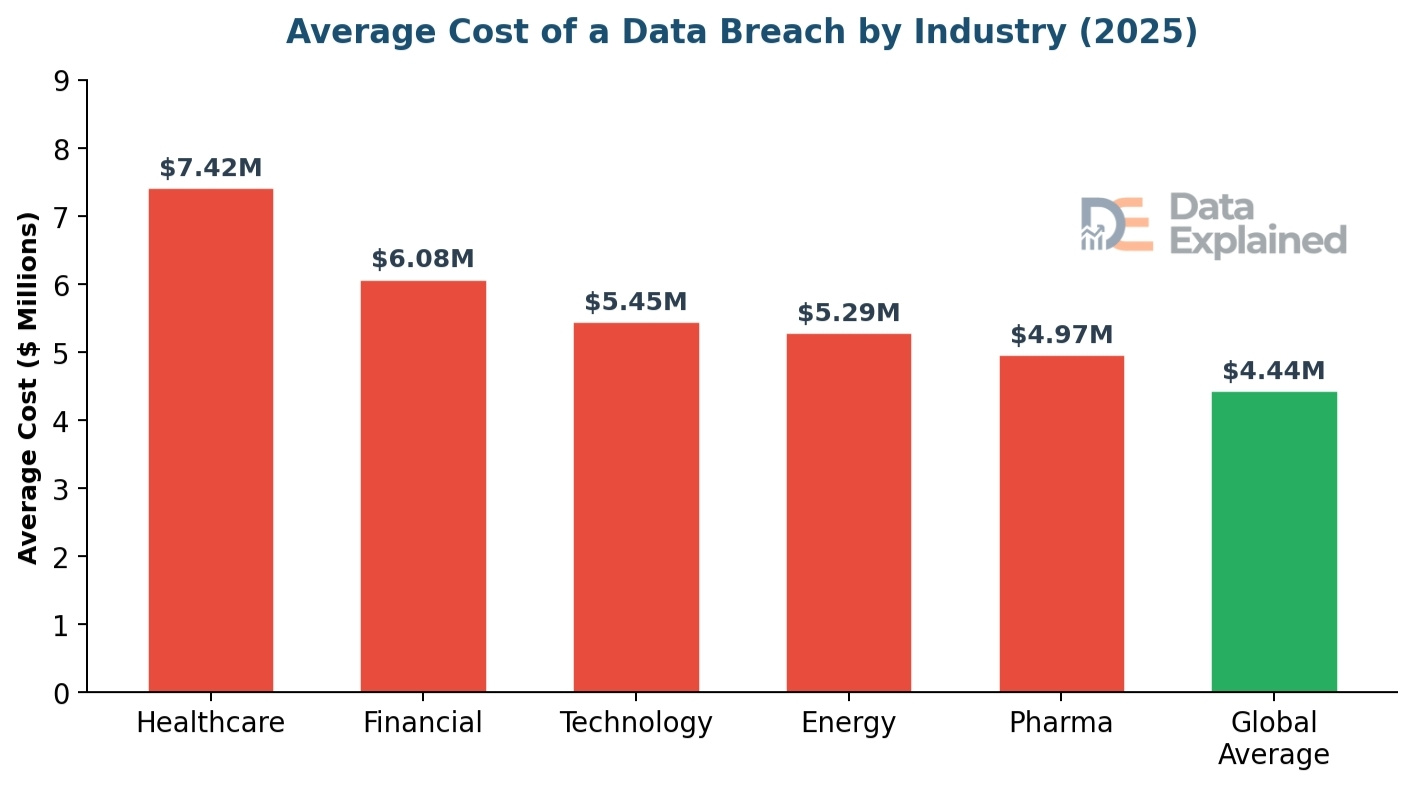
The global average cost of a data breach reached an all-time high of $4.88 million in 2024. In 2025, it dropped slightly to $4.44 million, a 9% decrease, but it still represents an enormous financial burden.
In the United States, the average breach cost is $10.22 million, the highest in the world.
The Middle East is second at $7.29 million. Healthcare data breaches are the most expensive in the industry, averaging $7.42 million, and have been the costliest for 12 consecutive years.
It takes an average of 258 days to identify and contain a data breach. Breaches that took longer than 200 days cost significantly more, averaging $5.01 million.
The human element plays a major role in breaches.
According to the 2025 Verizon Data Breach Investigations Report, the human element, such as falling for phishing emails, using weak passwords, or making mistakes, was a factor in 68% of all breaches. Phishing simulations show that people click on malicious links in just 21 seconds and enter their data in just 28 seconds.
67% of data breaches involve external actors (hackers), while 30% involve insiders. 1 in 6 breaches in 2025 involved AI-driven attacks. In the first half of 2025 alone, about 166 million individuals were affected by data compromises in the United States.
The global cost of cybercrime grew at a 15% annual rate from 2021 to 2025 and is expected to reach $1 trillion per month by 2031.
One of the most devastating breaches of 2024 was the National Public Data breach, which exposed the personal information of nearly 3 billion U.S. individuals.
The stolen data, including names, Social Security numbers, and addresses, was listed on the dark web for $3.5 million.
The company subsequently filed for bankruptcy.
Third-party involvement in breaches doubled from the previous year, accounting for 30% of all breaches.
How Organizations Protect Data
Organizations use multiple layers of defense to protect their data.
No single tool or strategy is enough on its own, so a “layered security” approach is used, much like the layers of an onion.
Encryption is one of the most fundamental tools. It scrambles data into a code that can only be read by someone with the correct key. Even if a hacker steals encrypted data, they cannot read it without the key. Encryption is used for data in transit (between computers) and at rest (on a server).
Access controls limit who can see and use specific data. Role-based access means employees can access only the data they need for their jobs. Multi-factor authentication (MFA), which requires two or more verification factors (such as a password and a code sent to your phone), adds an extra layer of protection.
Security monitoring and audits involve continuously monitoring networks and systems for suspicious activity. Intrusion detection systems, security information and event management (SIEM) tools, and regular security audits help catch threats early.
Employee training is critical because human error is such a large factor in breaches. Organizations train employees to recognize phishing emails, use strong passwords, handle sensitive data properly, and report suspicious activity.
AI-powered security tools are becoming increasingly important in the fight against cybercrime. These tools can analyze network traffic, detect anomalies, and respond to threats much faster than humans alone.
Organizations that extensively use AI and automation in their security systems identified and contained breaches 80 days faster and saved nearly $1.9 million compared to organizations without these tools.
Zero Trust architecture is a security approach built on the principle of “never trust, always verify.” Instead of assuming that anyone inside the company network can be trusted, Zero Trust requires continuous verification for every user and device, every time they try to access anything.
Global cybersecurity spending is expected to grow by 12.2% in 2025 and surpass $377 billion by 2028. Organizations spent roughly $193 billion on IT security in 2022, and spending continues to rise.
Chapter 10: The Future of Data
Data is not slowing down. If anything, data growth is accelerating, driven by new technologies, expanding internet access, and the rise of AI.
In this final main section, we will look at where data is heading, the emerging trends that will shape the next decade, and the challenges we must overcome.
Data Growth Projections
The numbers for future data growth are staggering.
From 181 zettabytes in 2025, global data creation is expected to nearly double again within just a few years.
DO YOU KNOW?
- By 2028, global data creation is projected to reach 394 zettabytes. That is more than double the 2025 figure and nearly 200 times the amount of data in 2010.
- The global data storage market is projected to grow to $774 billion by 2032. The Big Data analytics market is expected to grow from $308 billion in 2023 to $924 billion by 2032. Cloud storage alone is expected to hold 100 zettabytes by 2025.
Several major forces are driving this growth.
The Internet of Things (IoT) is adding billions of new data-generating devices every year. 5G networks are enabling faster data transfer, which encourages more data creation.
Artificial intelligence itself generates data as it processes, learns, and creates content.
Autonomous vehicles, smart cities, digital healthcare, remote work, and the expansion of internet access in developing countries are all contributing to the data explosion.
By 2025, 5G and mobile devices are expected to account for nearly 80% of all internet traffic, with smartphones alone making up more than 55%.
Emerging Trends
Edge computing is the practice of processing data closer to where it is generated rather than sending everything to a central cloud. For applications that require instant responses, such as self-driving cars, factory robots, and augmented reality, even a tiny delay can be problematic. Edge computing reduces that delay by keeping the data processing close to the source.
Quantum computing is a new type of computing that uses the principles of quantum physics to process information. While still in their early stages, quantum computers have the potential to solve problems that traditional computers cannot, including analyzing massive datasets, breaking current encryption methods, and simulating complex molecular structures for drug discovery.
Data mesh is a new approach to data management in which, instead of having a single central team manage all of a company’s data, each team “owns” and manages the data it creates. This decentralized approach makes data management more scalable and gives teams more control over their own data.
Synthetic data is artificially generated data created by computer algorithms. It is used to train AI models when real data is too sensitive, too scarce, or too biased. For example, a hospital might use synthetic patient data to train an AI system without risking anyone’s privacy.
Privacy-enhancing technologies (PETs) are tools that enable data analysis without exposing raw data. Examples include differential privacy (adding small amounts of noise to data to protect individual identities), homomorphic encryption (performing calculations on encrypted data without decrypting it), and federated learning (training AI models across multiple devices without sharing the raw data).
Data sovereignty is the concept that data is subject to the laws of the country where it is collected or stored. More and more countries are requiring that data about their citizens be physically stored within their borders. This creates both compliance challenges for global companies and opportunities for local data center growth.
Challenges Ahead
Despite the opportunities, the future of data also presents serious challenges that individuals, organizations, and governments will need to address.
DO YOU KNOW?
- 76% of companies find it challenging to understand their data, and 82% struggle with data management issues. 44% of professionals say that understanding Big Data is a major hurdle in shifting to data-driven work.
The environmental impact of data is a growing concern. Data centers consume enormous amounts of electricity and water for cooling.
As data volumes grow, so does the energy required to store and process them.
The technology industry is racing to develop more energy-efficient data centers and to power them with renewable energy, but the challenge is immense.
The cybersecurity skills gap is another pressing issue. As cyber threats grow more sophisticated, the demand for cybersecurity professionals far outstrips the supply. 50% of organizations that experienced data breaches reported staffing shortages as a contributing factor.
This gap is expected to persist for years.
Keeping up with privacy regulations is a challenge for businesses operating across multiple countries.
With over 170 countries having their own data privacy laws and new laws being passed every year, compliance has become a major cost center and operational burden.
Finally, the ethical challenges around AI, bias, surveillance, and data ownership are not going away.
They are becoming more complex as technology advances. Finding the right balance between innovation and protection, between data use and data rights, will be one of the defining challenges of the coming decade.
Data Jargon We Used & Their Meaning
| wdt_ID | wdt_created_by | wdt_created_at | wdt_last_edited_by | wdt_last_edited_at | Term | Definition |
|---|---|---|---|---|---|---|
| 1 | emmanuel-ashemiriogwa | 24/02/2026 12:45 AM | emmanuel-ashemiriogwa | 24/02/2026 12:45 AM | Algorithm | A step-by-step set of instructions that a computer follows to solve a problem or complete a task. |
| 2 | emmanuel-ashemiriogwa | 24/02/2026 12:45 AM | emmanuel-ashemiriogwa | 24/02/2026 12:45 AM | API | Application Programming Interface. A set of rules that allows different software programs to communicate with each other. |
| 3 | emmanuel-ashemiriogwa | 24/02/2026 12:45 AM | emmanuel-ashemiriogwa | 24/02/2026 12:45 AM | Big Data | Extremely large and complex data sets require advanced tools to process and analyze. |
| 4 | emmanuel-ashemiriogwa | 24/02/2026 12:45 AM | emmanuel-ashemiriogwa | 24/02/2026 12:45 AM | Cloud Computing | Using remote servers on the internet to store, manage, and process data instead of local servers. |
| 5 | emmanuel-ashemiriogwa | 24/02/2026 12:45 AM | emmanuel-ashemiriogwa | 24/02/2026 12:45 AM | Data Breach | An incident where sensitive or protected data is accessed, stolen, or exposed without authorization. |
| 6 | emmanuel-ashemiriogwa | 24/02/2026 12:45 AM | emmanuel-ashemiriogwa | 24/02/2026 12:45 AM | Data Center | A large facility that houses computer servers and storage equipment for organizations. |
| 7 | emmanuel-ashemiriogwa | 24/02/2026 12:45 AM | emmanuel-ashemiriogwa | 24/02/2026 12:45 AM | Data Lake | A storage system that holds raw data in its original format until it is needed for analysis. |
| 8 | emmanuel-ashemiriogwa | 24/02/2026 12:45 AM | emmanuel-ashemiriogwa | 24/02/2026 12:45 AM | Data Warehouse | A storage system where data is cleaned, organized, and optimized for fast querying and reporting. |
| 9 | emmanuel-ashemiriogwa | 24/02/2026 12:45 AM | emmanuel-ashemiriogwa | 24/02/2026 12:45 AM | Encryption | The process of converting data into a coded format to prevent unauthorized access. |
| 10 | emmanuel-ashemiriogwa | 24/02/2026 12:45 AM | emmanuel-ashemiriogwa | 24/02/2026 12:45 AM | ETL | Extract, Transform, Load. The process of pulling data from sources, converting it, and loading it into a system. |
Sources and References
Throughout this in-depth article, we draw on data and statistics from the following authoritative sources.
P.S: Consult these sources for additional detail and the most up-to-date figures. Data used are accurate at the time of publishing.
1. IBM Cost of a Data Breach Report (2024, 2025)
2. Verizon Data Breach Investigations Report (DBIR) (2024, 2025)
3. Statista: Global Data Volume and Data Center Statistics
4. IDC (International Data Corporation): Global DataSphere Forecast
5. Cybersecurity Ventures: Cybercrime and Data Storage Reports
6. IAPP (International Association of Privacy Professionals): Global Privacy Law Tracker
7. Fortune Business Insights: Data Science Platform Market Report
8. Precedence Research: Data Science Platform Market Analysis
9. Grand View Research: Data Science Platform Market Report
10. Gartner: Cloud Computing and IT Spending Forecasts
11. DLA Piper: Data Protection Laws of the World Handbook (2025)
12. UNCTAD: Data Protection and Privacy Legislation Worldwide
13. DE-CIX: Global Data Traffic Reports (2024)
14. Soax Research: Data Generated Per Day Statistics
15. RBC Capital Markets: Healthcare Data Explosion Report
16. U.S. Bureau of Labor Statistics: Employment Projections (2024-2034)
17. CDC Public Health Data Strategy (2025-2026)
18. Health Affairs Journal: National Health Expenditure Projections
19. World Economic Forum: Global Cybersecurity Outlook Report (2025)
20. Secure Privacy: Data Privacy Trends 2026 Report