
From a global perspective, initial public offering volume fell 61% in the first quarter of 2026 compared to the same period a year earlier.
It’s the worst quarterly performance since the depths of the 2008 financial crisis, according to data from Renaissance Capital and Dealogic.
The last time the market for new stock listings performed this badly, Lehman Brothers had just collapsed, credit markets had frozen, and the global economy was contracting.
In Q1 2026, none of those conditions has been confirmed. The market is pricing crisis-level fear without a confirmed crisis.
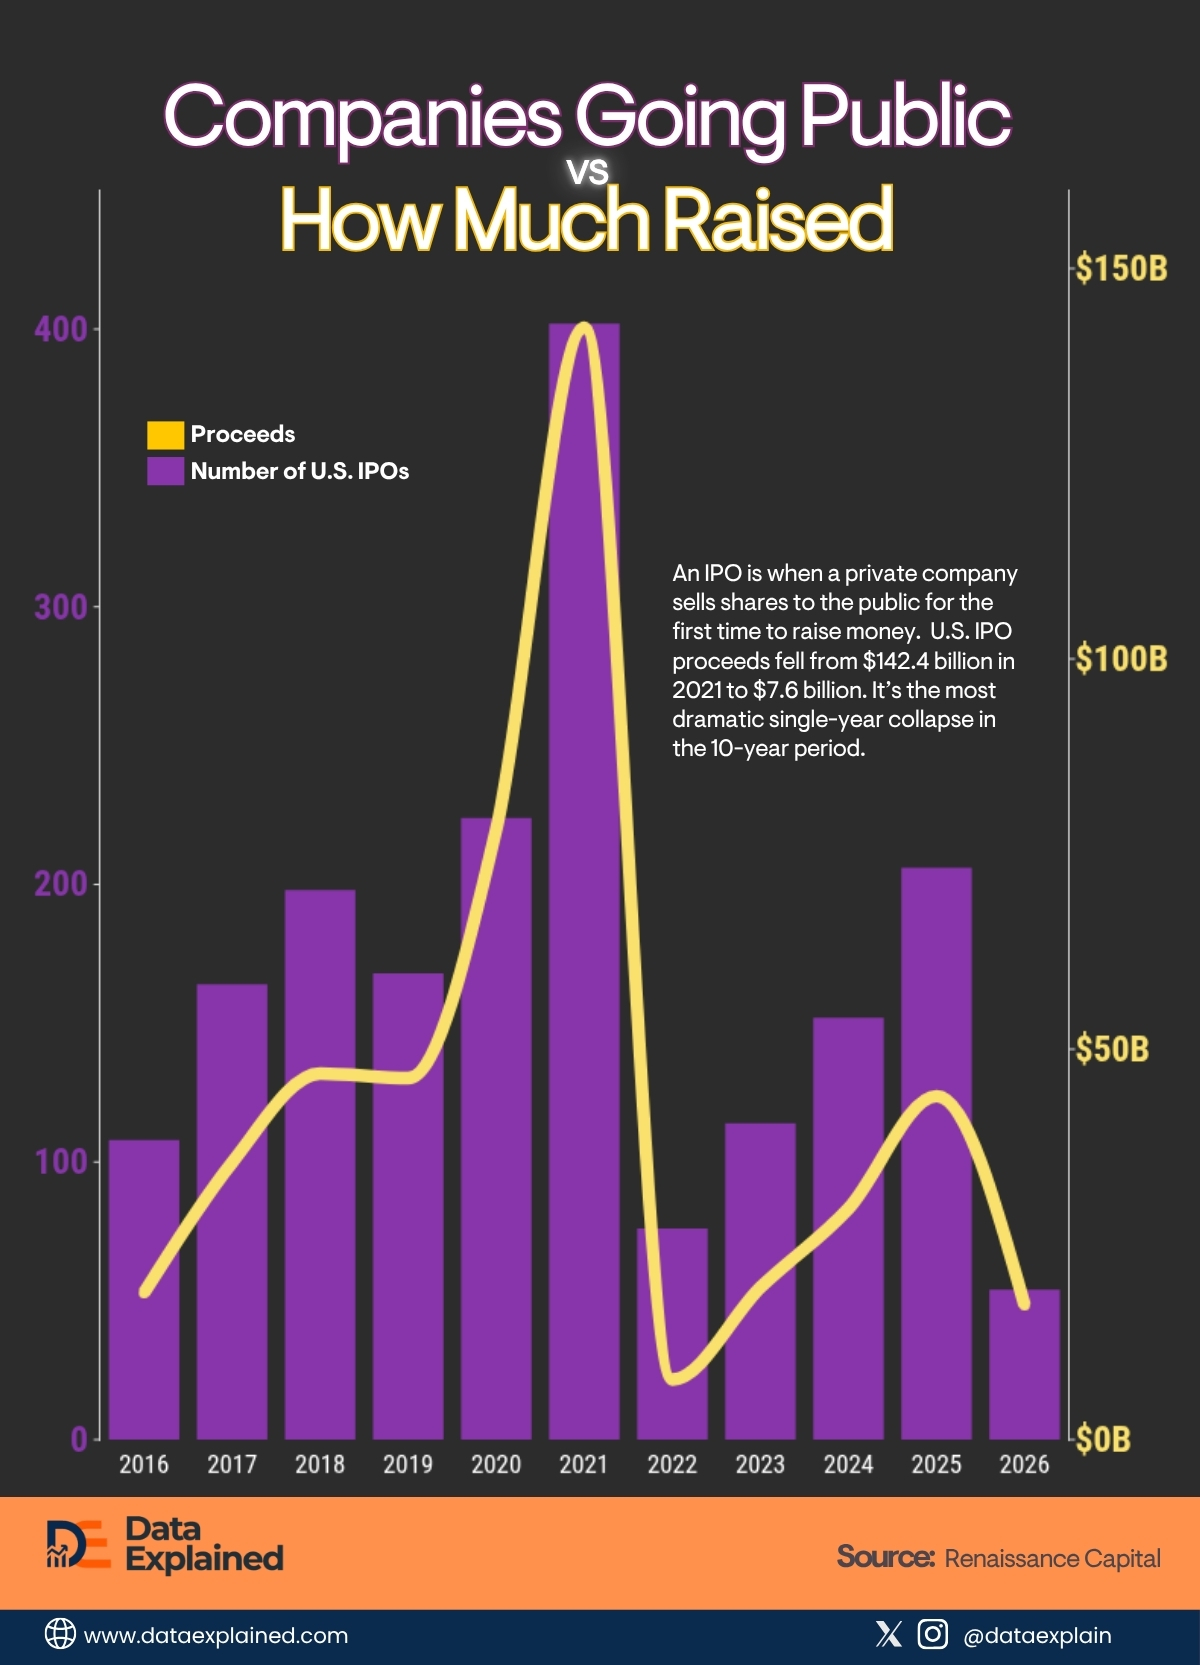
A Renaissance Capital data tracking the U.S. IPO market from 2016 to 2026 provides the decade-long context for that single quarterly number.
TL;DR
- U.S. IPO proceeds fell from $142.4 billion to $7.6 billion in twelve months, a ratio of 18.75 to 1. It’s the most dramatic single-year collapse in the dataset.
| wdt_ID | wdt_created_by | wdt_created_at | wdt_last_edited_by | wdt_last_edited_at | Year | Proceeds ($B) | Number of IPOs |
|---|---|---|---|---|---|---|---|
| 1 | emmanuel-ashemiriogwa | 04/05/2026 06:29 PM | emmanuel-ashemiriogwa | 04/05/2026 06:29 PM | 2016 | 18.8 | 108.0 |
| 2 | emmanuel-ashemiriogwa | 04/05/2026 06:29 PM | emmanuel-ashemiriogwa | 04/05/2026 06:29 PM | 2017 | 35.5 | 164.0 |
| 3 | emmanuel-ashemiriogwa | 04/05/2026 06:29 PM | emmanuel-ashemiriogwa | 04/05/2026 06:29 PM | 2018 | 46.9 | 198.0 |
| 4 | emmanuel-ashemiriogwa | 04/05/2026 06:29 PM | emmanuel-ashemiriogwa | 04/05/2026 06:29 PM | 2019 | 46.3 | 168.0 |
| 5 | emmanuel-ashemiriogwa | 04/05/2026 06:29 PM | emmanuel-ashemiriogwa | 04/05/2026 06:29 PM | 2020 | 78.2 | 224.0 |
| 6 | emmanuel-ashemiriogwa | 04/05/2026 06:29 PM | emmanuel-ashemiriogwa | 04/05/2026 06:29 PM | 2021 | 142.4 | 402.0 |
| 7 | emmanuel-ashemiriogwa | 04/05/2026 06:29 PM | emmanuel-ashemiriogwa | 04/05/2026 06:29 PM | 2022 | 7.7 | 76.0 |
| 8 | emmanuel-ashemiriogwa | 04/05/2026 06:29 PM | emmanuel-ashemiriogwa | 04/05/2026 06:29 PM | 2023 | 19.5 | 114.0 |
| 9 | emmanuel-ashemiriogwa | 04/05/2026 06:29 PM | emmanuel-ashemiriogwa | 04/05/2026 06:29 PM | 2024 | 29.6 | 152.0 |
| 10 | emmanuel-ashemiriogwa | 04/05/2026 06:29 PM | emmanuel-ashemiriogwa | 04/05/2026 06:29 PM | 2025 | 44.0 | 206.0 |
The Decade in Numbers
The U.S. IPO market, measured by proceeds from offerings with market caps of $50 million or more, has experienced two distinct cycles over the past decade.
The first ran from a modest $18.8 billion in 2016, through a climb to $78.2 billion in 2020, and then to an extraordinary $142.4 billion peak in 2021.
That peak was driven by a combination of near-zero interest rates, pandemic-era retail investor speculation, and a surge in Special Purpose Acquisition Companies (SPACs).
Then 2022 arrived. The Federal Reserve raised interest rates by 425 basis points in a single year, the fastest hiking cycle in modern history.
Risk appetite collapsed.
SPACs became effectively uninvestable after regulatory tightening.
IPO proceeds fell from $142.4 billion to $7.6 billion in twelve months, a ratio of 18.75 to 1. It’s the most dramatic single-year collapse in the dataset.
The Recovery That Broke
What followed was three consecutive years of rebuilding.
Proceeds reached $19.5 billion in 2023, $29.6 billion in 2024, and $44 billion in 2025, the highest since the 2021 peak and approximately matching pre-pandemic 2019 levels of $46.3 billion.
The number of IPOs recovered from an approximate trough of 70 in 2022 to approximately 250 in 2025.
The trajectory looked sustainable. Then Q1 2026 broke the arc.
The chart shows 2026 proceeds of $17.2 billion (a partial-year figure) with IPO deal counts tracking back toward the 2022 trough of approximately 70.
The cause this time is a combination of tariff escalation following the Trump administration’s April 2026 “Liberation Day” announcements and rising recession probability.
Two Crashes, Same Depth, Different Causes
The most analytically striking feature of the current environment is that Q1 2026 IPO activity has reached approximately the same depth as the 2022 trough despite an entirely different set of causes.
In 2022, a monetary policy shock destroyed the conditions that made 2021 possible.
In 2026, a trade and geopolitical shock is producing equivalent market paralysis in an economy with lower interest rates and no systemic financial breakdown.
The IPO market is binary in a way most financial markets are not.
It is either open (companies can list at prices they find acceptable, and investors will buy) or it is closed.
The conditions that keep it open require not just adequate valuations but confidence in the forward outlook.
Companies do not go public when the next six months are uncertain because the price they receive in an IPO reflects that uncertainty directly.
Every percentage point rise in recession probability is a valuation compression for companies considering listings.
ELI5
An IPO is when a private company sells shares to the public for the first time to raise money. In early 2026, almost no companies did this (the fewest since the 2008 financial crisis) because markets are too uncertain due to trade wars and recession fears.
After three years of recovery from a previous crash, the IPO market has frozen again, and many companies are waiting for better conditions before going public.
Source:
Renaissance Capital, U.S. IPO Market (2016-2026)