
It may surprise you to learn that companies worldwide spent about $1.09 trillion on digital advertising. And that was only in 2024.
That amount on ads could rival the GDP of a small nation or even buy almost 30 million new Teslas.
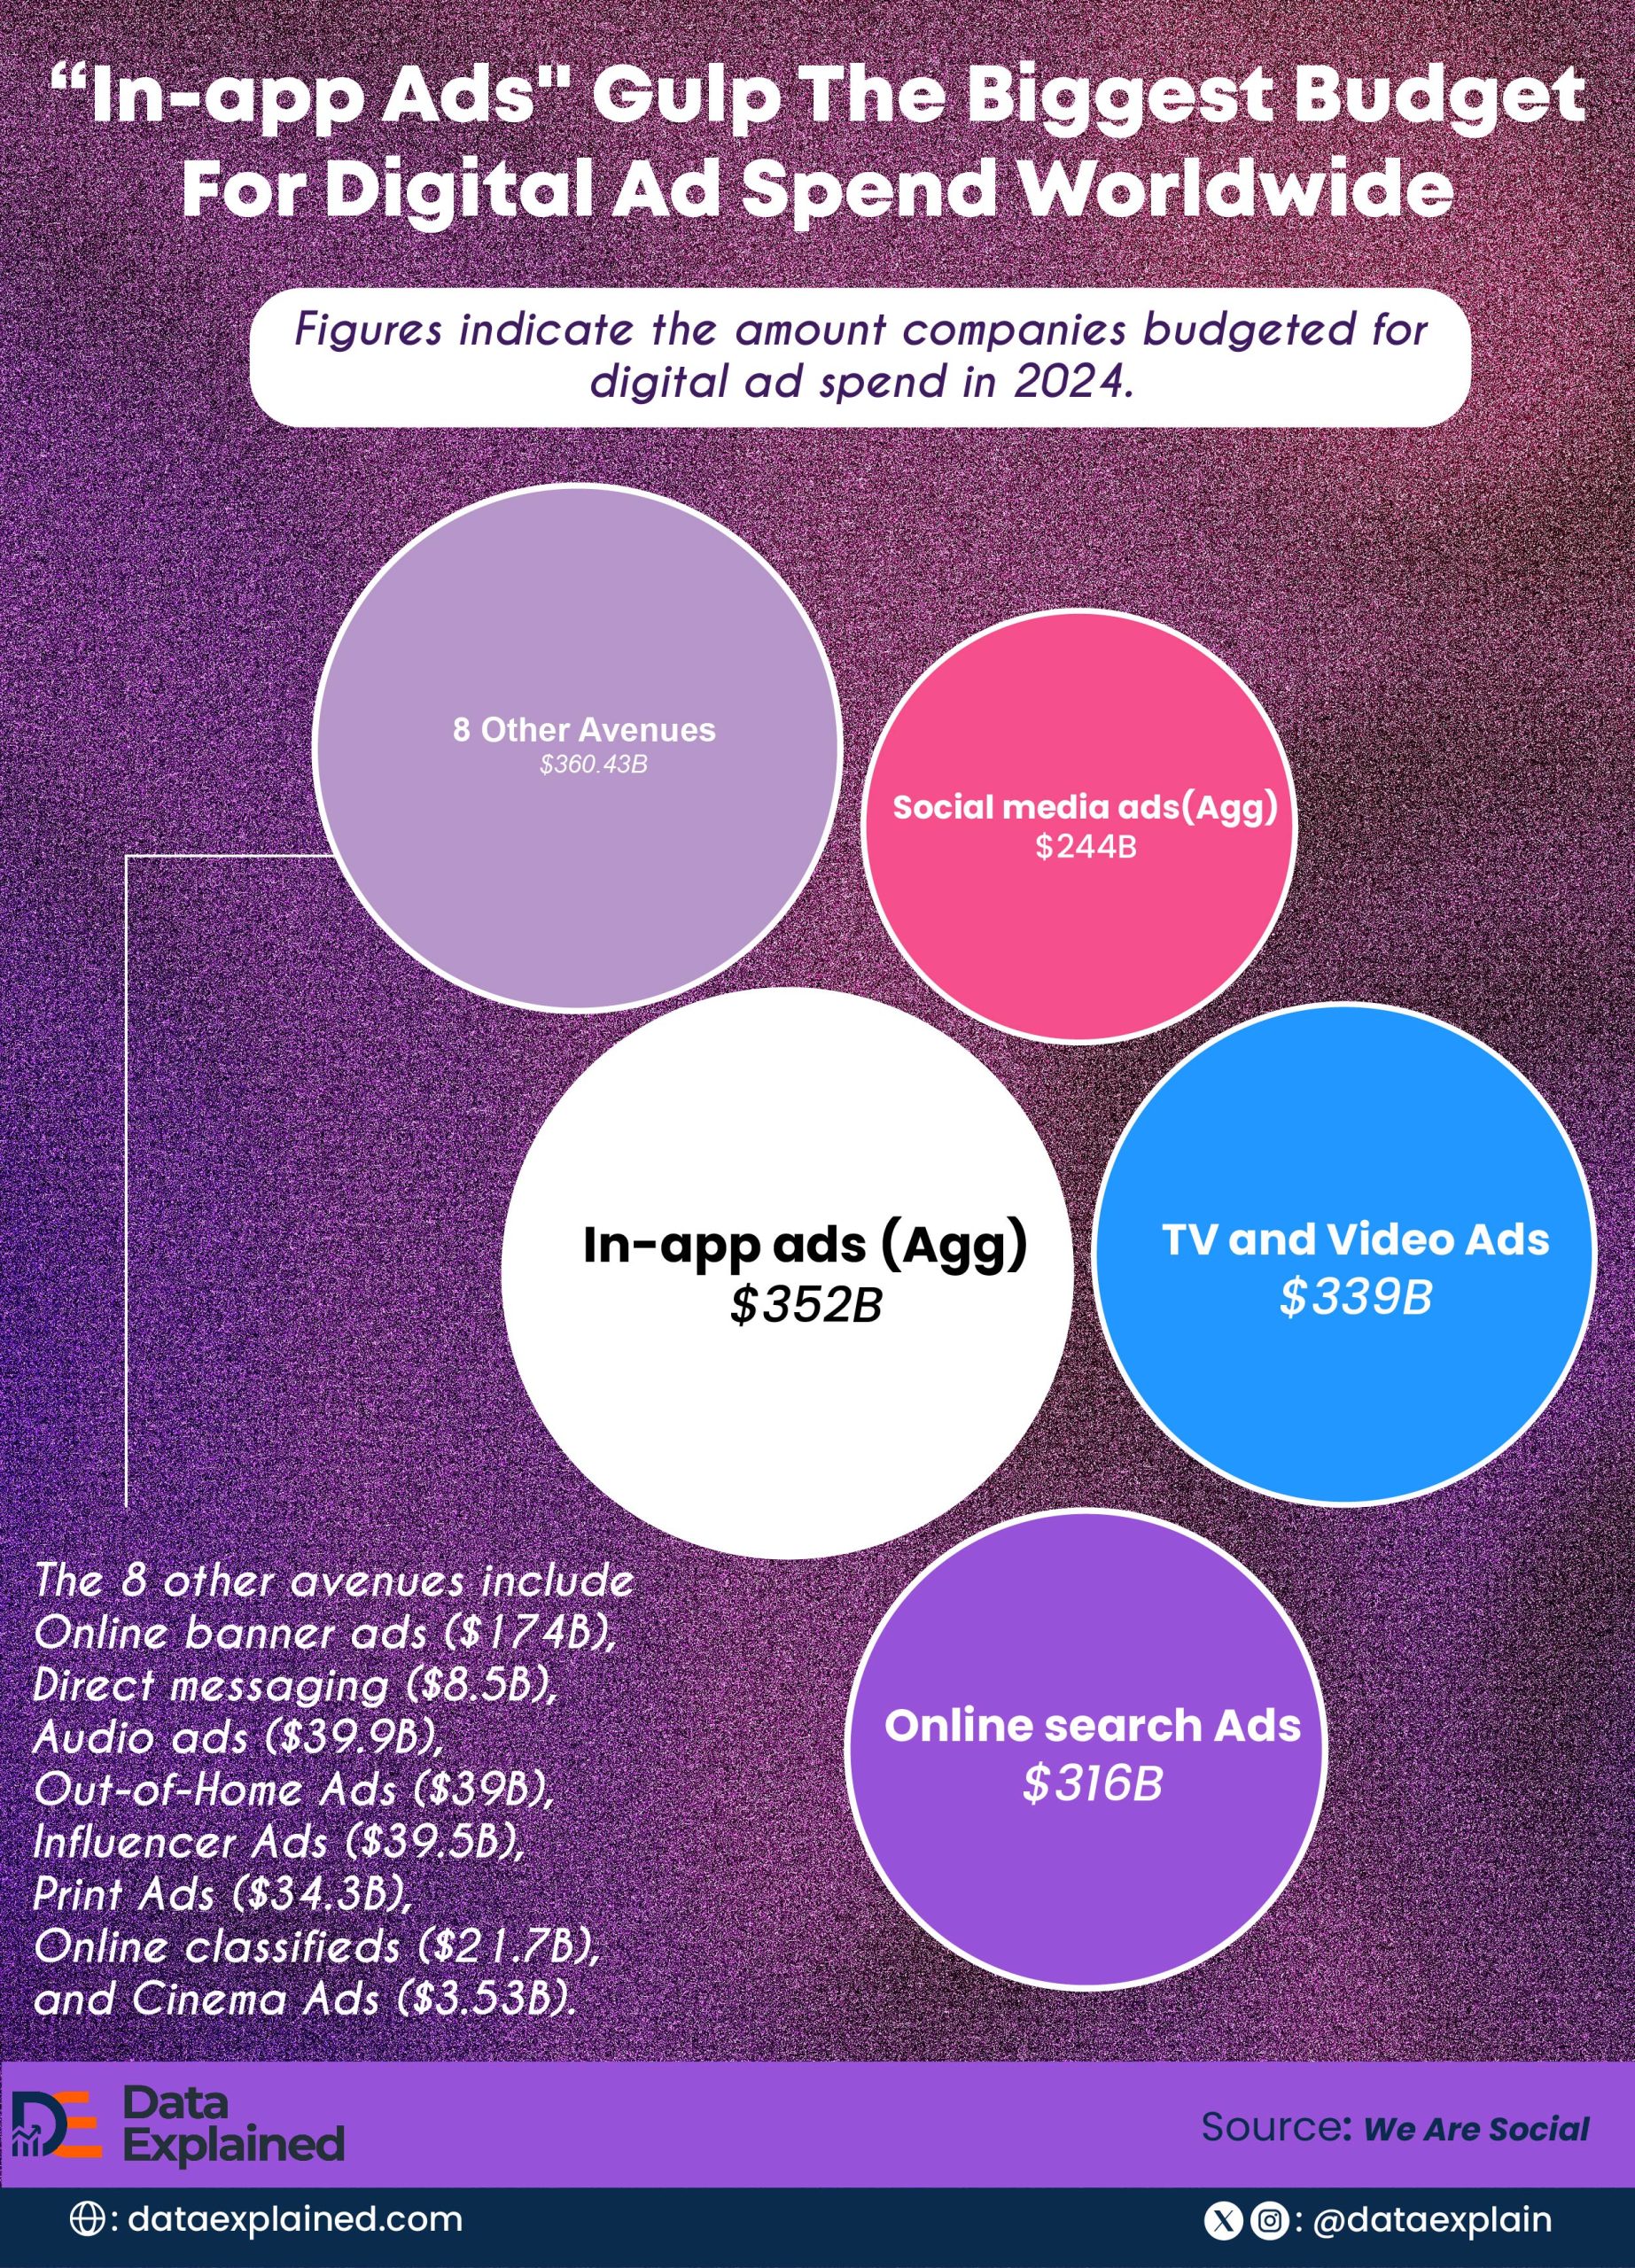
This visualization shows the top spenders on digital adverts by platform, based on data from We Are Social.
TL;DR
- In-app, TV/video, and search ads have the highest budgets, while smaller formats like messaging and cinema remain niche.
- FMCG, retail, and healthcare are the biggest spenders in the digital ad industry.
As you can see in the table below, “In-app ads” lead in ad spending, accounting for the largest share of advertising budgets.
| wdt_ID | wdt_created_by | wdt_created_at | wdt_last_edited_by | wdt_last_edited_at | Channel | Amount ($/billion) |
|---|---|---|---|---|---|---|
| 1 | Monica Ebunoluwa | 10/02/2026 10:11 AM | Monica Ebunoluwa | 10/02/2026 10:11 AM | In-app ads (Agg) | 352 |
| 2 | Monica Ebunoluwa | 10/02/2026 10:11 AM | Monica Ebunoluwa | 10/02/2026 10:11 AM | TV and Video Ads | 339 |
| 3 | Monica Ebunoluwa | 10/02/2026 10:11 AM | Monica Ebunoluwa | 10/02/2026 10:11 AM | Online search Ads | 316 |
| 4 | Monica Ebunoluwa | 10/02/2026 10:11 AM | Monica Ebunoluwa | 10/02/2026 10:11 AM | Social media ads (Agg) | 244 |
| 5 | Monica Ebunoluwa | 10/02/2026 10:11 AM | Monica Ebunoluwa | 10/02/2026 10:11 AM | Online banner ads | 174 |
| 6 | Monica Ebunoluwa | 10/02/2026 10:11 AM | Monica Ebunoluwa | 10/02/2026 10:11 AM | Direct messaging | 9 |
| 7 | Monica Ebunoluwa | 10/02/2026 10:11 AM | Monica Ebunoluwa | 10/02/2026 10:11 AM | Audio ads | 40 |
| 8 | Monica Ebunoluwa | 10/02/2026 10:11 AM | Monica Ebunoluwa | 10/02/2026 10:11 AM | Out-of-Home Ads | 39 |
| 9 | Monica Ebunoluwa | 10/02/2026 10:11 AM | Monica Ebunoluwa | 10/02/2026 10:11 AM | Influencer Ads | 40 |
| 10 | Monica Ebunoluwa | 10/02/2026 10:11 AM | Monica Ebunoluwa | 10/02/2026 10:11 AM | Print Ads | 34 |
Streaming services and online video platforms continue to invest heavily in brand-building campaigns, driven by strong performance.
Across channels, there’s a pattern showing that high daily usage gets the largest share of spending.
For example, social media ads at $244 billion and online banners at $174 billion show that wider digital reach and programme advertising are key to advertiser strategies.
According to the report, total digital ad spend in 2024 is $1.009 trillion, up about 9.5% from 2023.
Advertising Industry Has Been on a Roll Since 2019
| wdt_ID | wdt_created_by | wdt_created_at | wdt_last_edited_by | wdt_last_edited_at | Year | Amount |
|---|---|---|---|---|---|---|
| 1 | Monica Ebunoluwa | 20/02/2026 10:59 AM | Monica Ebunoluwa | 20/02/2026 10:59 AM | 2,019 | $721 billion |
| 2 | Monica Ebunoluwa | 20/02/2026 10:59 AM | Monica Ebunoluwa | 20/02/2026 10:59 AM | 2,020 | $753 billion |
| 3 | Monica Ebunoluwa | 20/02/2026 10:59 AM | Monica Ebunoluwa | 20/02/2026 10:59 AM | 2,021 | $857 billion |
| 4 | Monica Ebunoluwa | 20/02/2026 10:59 AM | Monica Ebunoluwa | 20/02/2026 10:59 AM | 2,022 | $943 billion |
| 5 | Monica Ebunoluwa | 20/02/2026 10:59 AM | Monica Ebunoluwa | 20/02/2026 10:59 AM | 2,023 | $1.01 trillion |
| 6 | Monica Ebunoluwa | 20/02/2026 10:59 AM | Monica Ebunoluwa | 20/02/2026 10:59 AM | 2,024 | $1.09 trillion |
The industry grew from $721 billion in 2019 to $1.09 trillion in 2024, showing expansion despite economic uncertainty.
The most significant jump occurred in 2021, driven by the post-pandemic, rapid expansion of digital-first business models.
Spending also continued to rise, with 2023 and 2024 confirming a sustained industry momentum.
The shift toward digital platforms shapes this trend.
Digital advertising now accounts for the majority of global ad spend, driven by mobile usage, social platforms, and performance-based search ads.
The current digital advertising market size is roughly $790 billion to $800 billion in 2024, representing the largest share of the total $1.09 trillion ad spend.
Projections indicate digital ad spending will continue to grow in the high single digits annually.
Which Industry Spent the Most on Digital Adverts?
Companies that sell everyday essentials like food, drinks, toiletries, and cleaning supplies dominated the share of digital ad spending.
This category is called the Fast-Moving Consumer Goods (FMCG) industry.
Below is a table showing the percentage share of total ad spending across industries.
| wdt_ID | wdt_created_by | wdt_created_at | wdt_last_edited_by | wdt_last_edited_at | Industry | Percentage of Ad Spending Total |
|---|---|---|---|---|---|---|
| 1 | Monica Ebunoluwa | 16/02/2026 11:36 AM | Monica Ebunoluwa | 16/02/2026 11:36 AM | FMGG | 21.60% |
| 2 | Monica Ebunoluwa | 16/02/2026 11:36 AM | Monica Ebunoluwa | 16/02/2026 11:36 AM | Retail | 12.30% |
| 3 | Monica Ebunoluwa | 16/02/2026 11:36 AM | Monica Ebunoluwa | 16/02/2026 11:36 AM | Pharma & Healthcare | 8.00% |
| 4 | Monica Ebunoluwa | 16/02/2026 11:36 AM | Monica Ebunoluwa | 16/02/2026 11:36 AM | Entertainment and media | 7.60% |
| 5 | Monica Ebunoluwa | 16/02/2026 11:36 AM | Monica Ebunoluwa | 16/02/2026 11:36 AM | Telecommunication | 7.10% |
| 6 | Monica Ebunoluwa | 16/02/2026 11:36 AM | Monica Ebunoluwa | 16/02/2026 11:36 AM | Travel and leisure | 6.80% |
| 7 | Monica Ebunoluwa | 16/02/2026 11:36 AM | Monica Ebunoluwa | 16/02/2026 11:36 AM | Financial services | 6.80% |
| 8 | Monica Ebunoluwa | 16/02/2026 11:36 AM | Monica Ebunoluwa | 16/02/2026 11:36 AM | Business services | 5.60% |
| 9 | Monica Ebunoluwa | 16/02/2026 11:36 AM | Monica Ebunoluwa | 16/02/2026 11:36 AM | Automobiles | 4.30% |
| 10 | Monica Ebunoluwa | 16/02/2026 11:36 AM | Monica Ebunoluwa | 16/02/2026 11:36 AM | Government | 4.00% |
FMCGs’ dominance shows how rapidly consumers purchase everyday goods and how much these brands depend on constant visibility and high-volume marketing.
Meanwhile, Pharma and Entertainment also have significant shares as both sectors depend on digital channels for consumer education and subscriptions.
The pattern shows that industries closest to everyday consumer decisions and frequent purchases spend the most.
ELI5: Digital Advert Spending Trend
Global digital ad spending hit $1.09 trillion in 2024 mainly because people now live on their phones and shop online more than ever. Businesses follow the eyeballs — so they pour money into the platforms people use the most.
Most of the cash goes to apps, online video, and search ads because that’s where attention is. Smaller channels stay small because fewer people see them.
Industries like FMCG, retail, and healthcare spend the most because they compete for customers every single day and need to stay visible.
Sources: