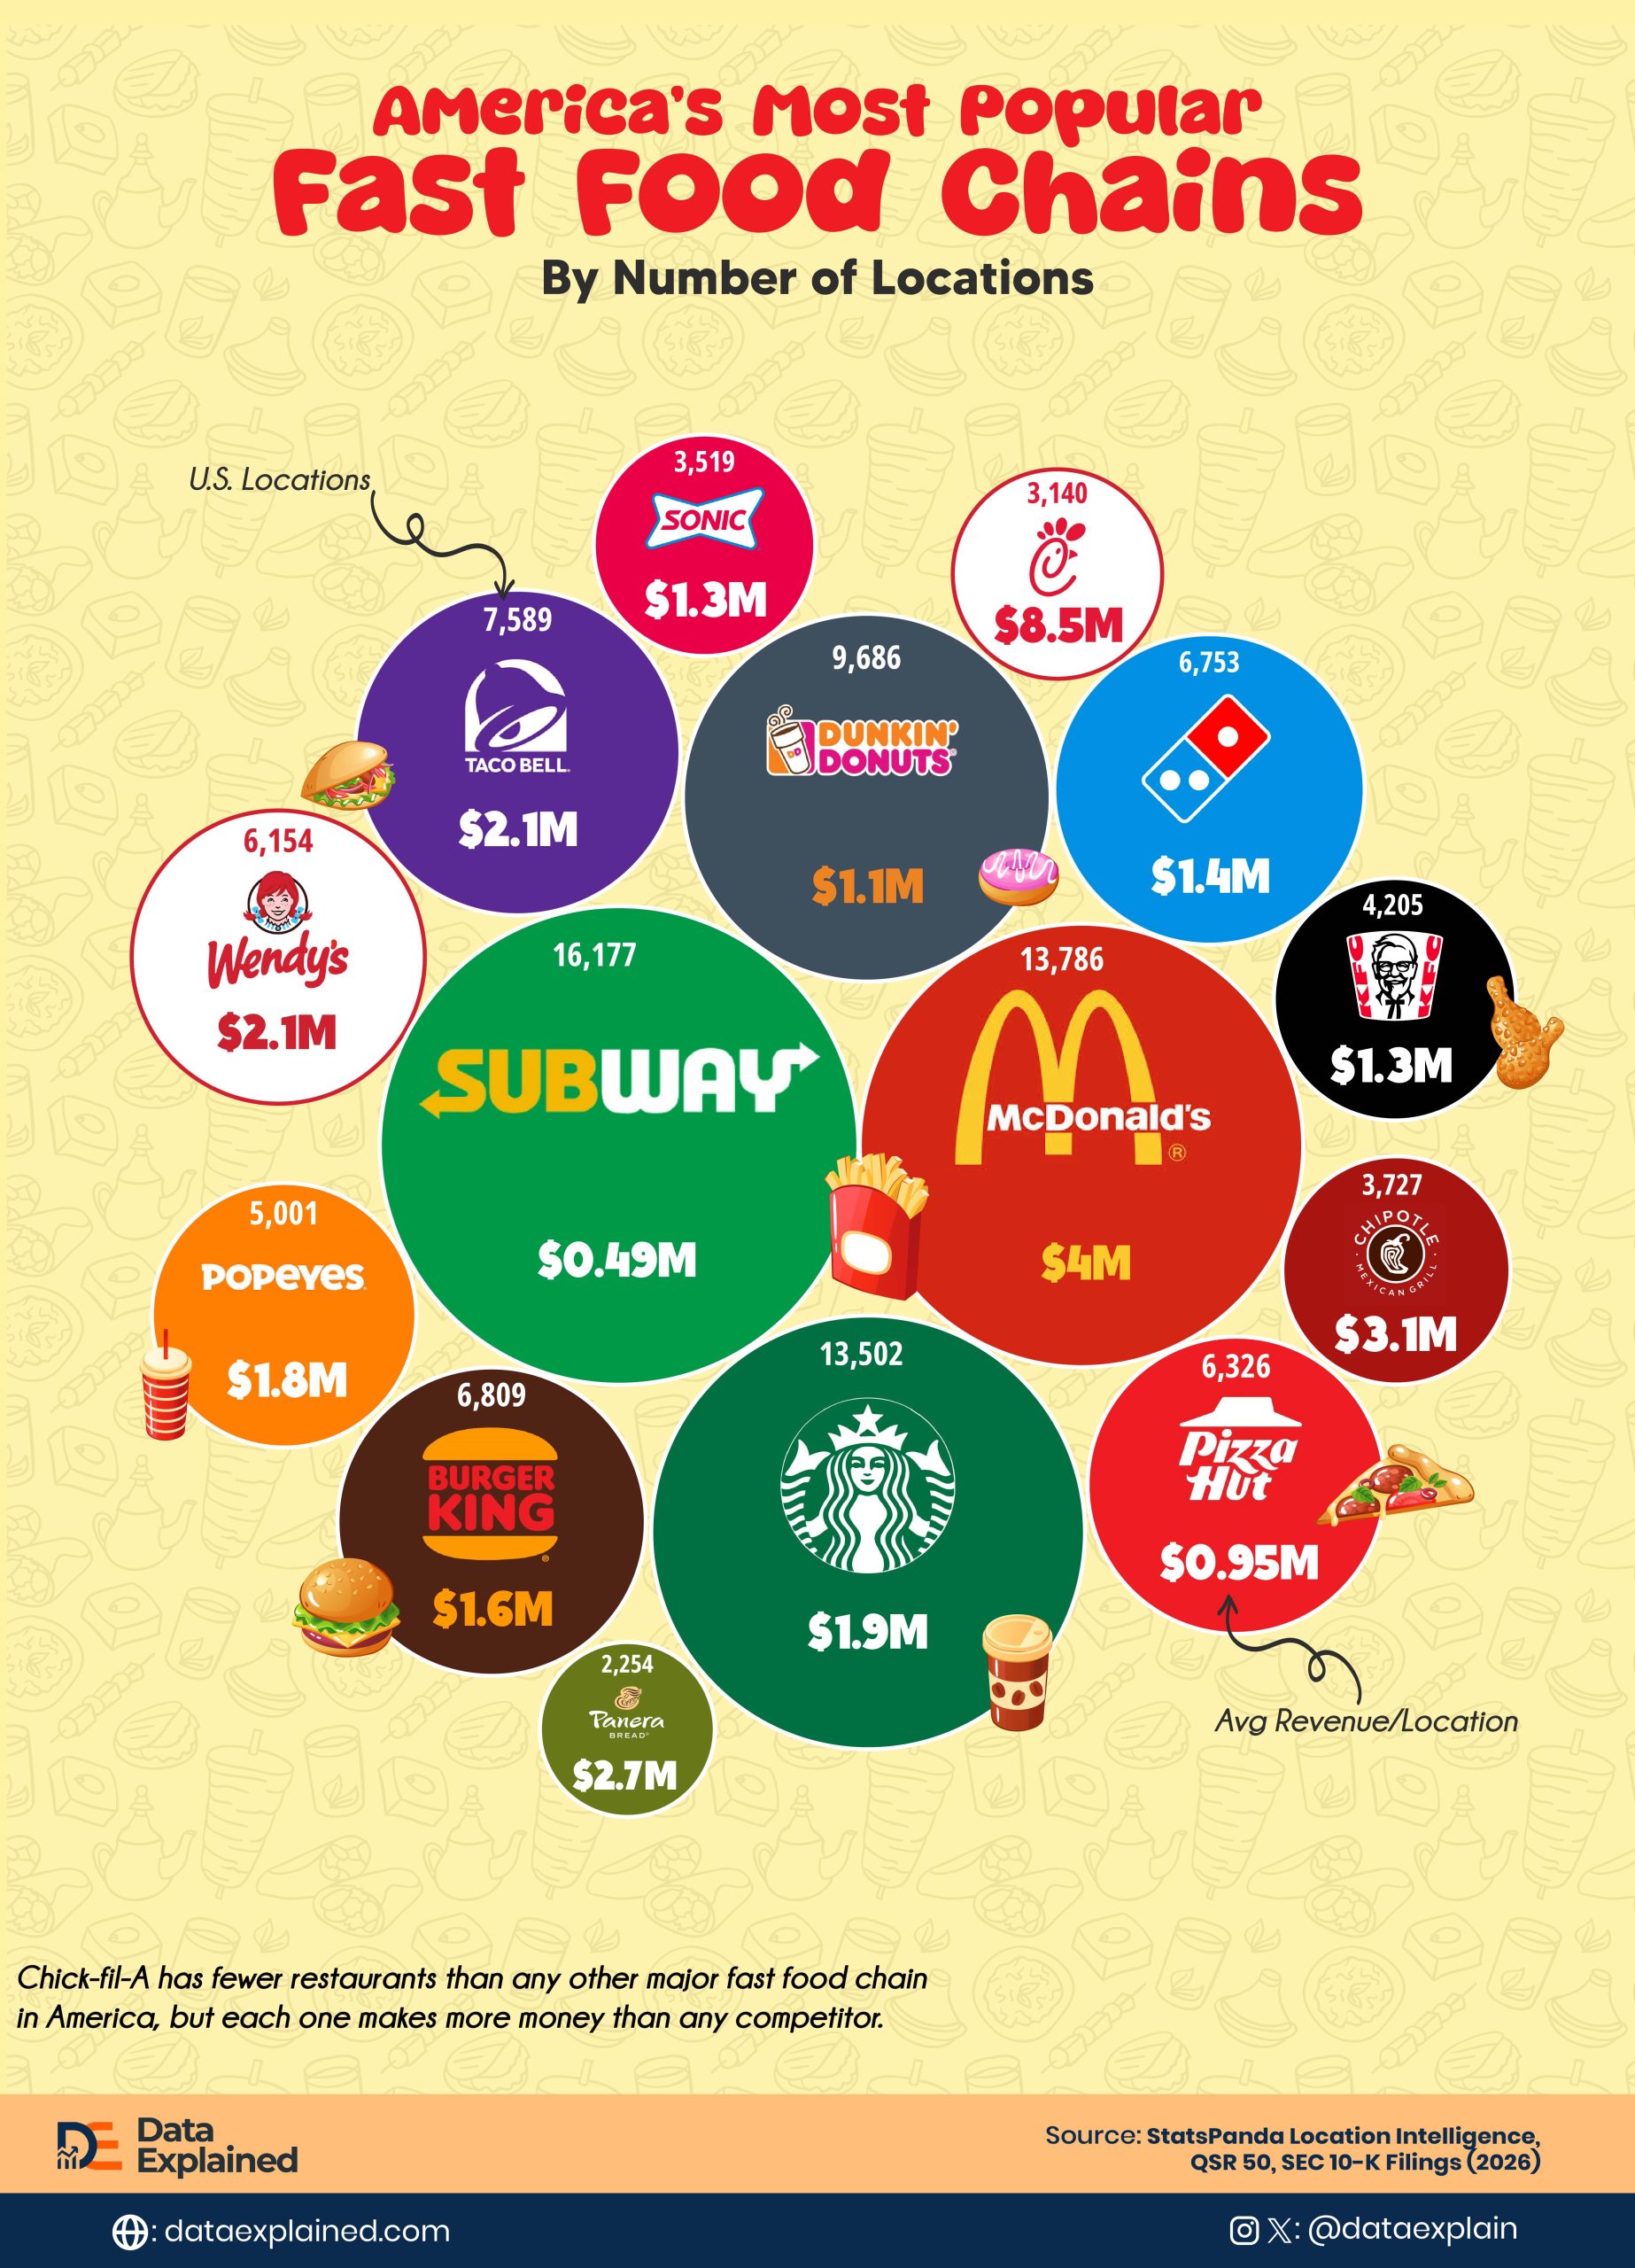
Chick-fil-A has 3,140 U.S. locations, the fewest of any chain in the top 15 fast food rankings for 2026.
It also generates an average of $8.5 million in revenue per location, the highest of any chain in the same ranking.
That’s the highlight of today’s data visualization.
In the chart above, we show the top 15 U.S. fast food chains across two metrics: total locations and average revenue per location in millions of dollars.
It is based on data from StatsPanda Location Intelligence, along with QSR 50 and SEC 10-K filings.
TL;DR
- Subway has the most U.S. locations at 16,177 but generates just $0.49 million per location, the lowest on record and roughly 17 times less than Chick-fil-A per store.
- McDonald’s is the only chain combining top-three location count (13,786) with top-two revenue per location ($4.0 million).
| wdt_ID | wdt_created_by | wdt_created_at | wdt_last_edited_by | wdt_last_edited_at | Rank | Fast Food Chain | U.S. Locations | Avg Revenue/Location ($M) |
|---|---|---|---|---|---|---|---|---|
| 1 | Patience | 11/08/2026 01:12 PM | Patience | 11/08/2026 01:12 PM | 1 | Subway | 16,177 | 0.49 |
| 2 | Patience | 11/08/2026 01:12 PM | Patience | 11/08/2026 01:12 PM | 2 | McDonald's | 13,786 | 4.00 |
| 3 | Patience | 11/08/2026 01:12 PM | Patience | 11/08/2026 01:12 PM | 3 | Starbucks | 13,502 | 1.90 |
| 4 | Patience | 11/08/2026 01:12 PM | Patience | 11/08/2026 01:12 PM | 4 | Dunkin' | 9,686 | 1.10 |
| 5 | Patience | 11/08/2026 01:12 PM | Patience | 11/08/2026 01:12 PM | 5 | Taco Bell | 7,589 | 2.10 |
| 6 | Patience | 11/08/2026 01:12 PM | Patience | 11/08/2026 01:12 PM | 6 | Burger King | 6,809 | 1.60 |
| 7 | Patience | 11/08/2026 01:12 PM | Patience | 11/08/2026 01:12 PM | 7 | Domino's | 6,753 | 1.40 |
| 8 | Patience | 11/08/2026 01:12 PM | Patience | 11/08/2026 01:12 PM | 8 | Pizza Hut | 6,326 | 0.95 |
| 9 | Patience | 11/08/2026 01:12 PM | Patience | 11/08/2026 01:12 PM | 9 | Wendy's | 6,154 | 2.10 |
| 10 | Patience | 11/08/2026 01:12 PM | Patience | 11/08/2026 01:12 PM | 10 | Popeyes | 5,001 | 1.80 |
ALSO READ: Ranked: World’s Best Cities for Food
The Subway Paradox
Subway has 16,177 U.S. locations, the largest fast food footprint in the country by a significant margin.
It also generates $0.49 million in average revenue per location, the lowest figure on record.
For context, a single Chick-fil-A location generates approximately 17.3 times more revenue than a single Subway location.
Subway’s model of low franchise barriers and aggressive expansion has produced the widest footprint and the thinnest per-unit economics in American fast food simultaneously.
The two facts are almost certainly connected.
ALSO READ: Ranked: World’s Largest Fast Food Chain
McDonald’s: The Exception
Only one chain in the top 15 combines high location count with high revenue per location.
McDonald’s has 13,786 U.S. stores (second nationally) and generates $4.0 million per location (second only to Chick-fil-A).
Every other chain on record trades one metric against the other. More locations tend to produce less revenue per location.
ALSO READ: Share of Income Spent on Food Around the World
Starbucks and Saturation Issue
Starbucks ranks third in U.S. locations at 13,502 but only seventh in revenue per location at $1.9 million.
A premium beverage brand with higher average transaction values than most fast food competitors sits in the middle of the efficiency ranking.
The most likely explanation is market saturation.
With over 13,500 U.S. locations, Starbucks outlets in dense urban and suburban markets are competing with each other for the same customer base.
That spreads revenue across more units rather than concentrating it.
ELI5
Chick-fil-A has fewer restaurants than any other major fast food chain in America, but each one makes more money than any competitor.
Subway has the most locations of any chain but makes the least per store, just $490,000.
McDonald’s is the only chain that manages to have lots of locations and still make a lot per store. In fast food, having more locations does not automatically mean making more money.
Source: