
On February 26, 2026, the Kalshi prediction market was pricing the probability of a U.S. recession this year at approximately 23%.
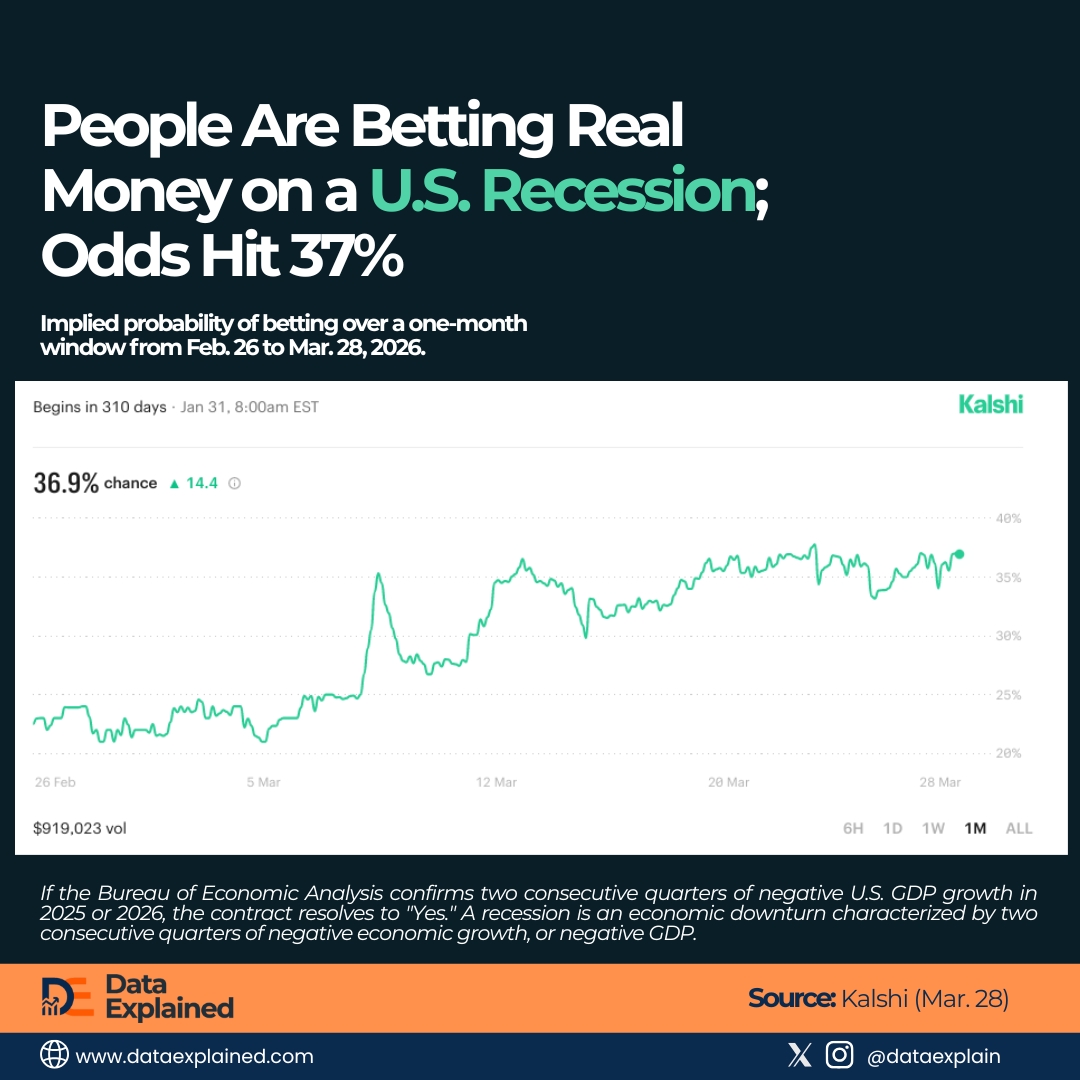
Four weeks later, that number sits at 36.9% (up 14.4 percentage points in a single month), backed by $919,023 in real-money trading volume.
Today’s visualization shows the implied probability of betting over a one-month window from February 26 to March 28, 2026.
The chart is currently telling a story that Goldman Sachs, one of Wall Street’s most closely watched macro teams, is telling in parallel: a U.S. recession in 2026 is no longer a tail risk.
TL;DR
- A recession is an economic downturn characterized by two consecutive quarters of negative economic growth, or negative GDP.
- As of March 28, more than one in three dollars bet on the probability of a recession says it will happen.
| wdt_ID | wdt_created_by | wdt_created_at | wdt_last_edited_by | wdt_last_edited_at | Period | Recession probability (%) |
|---|---|---|---|---|---|---|
| 1 | emmanuel-ashemiriogwa | 28/03/2026 10:51 AM | emmanuel-ashemiriogwa | 28/03/2026 10:51 AM | Feb 26 | 23.00 |
| 2 | emmanuel-ashemiriogwa | 28/03/2026 10:51 AM | emmanuel-ashemiriogwa | 28/03/2026 10:51 AM | Mar 5 | 21.50 |
| 3 | emmanuel-ashemiriogwa | 28/03/2026 10:51 AM | emmanuel-ashemiriogwa | 28/03/2026 10:51 AM | Mar 12 | 31.60 |
| 4 | emmanuel-ashemiriogwa | 28/03/2026 10:51 AM | emmanuel-ashemiriogwa | 28/03/2026 10:51 AM | Mar 20 | 35.70 |
| 5 | emmanuel-ashemiriogwa | 28/03/2026 10:51 AM | emmanuel-ashemiriogwa | 28/03/2026 10:51 AM | Mar 28 | 36.90 |
For context, the question that Kalshi market is answering has a specific resolution condition:
- If the Bureau of Economic Analysis confirms two consecutive quarters of negative U.S. GDP growth in 2025 or 2026, the contract resolves to “Yes.”
Every percentage point on the Kalshi chart represents the aggregated financial conviction of bettors who stand to gain or lose real money depending on whether they are right.
The Story Behind the Chart
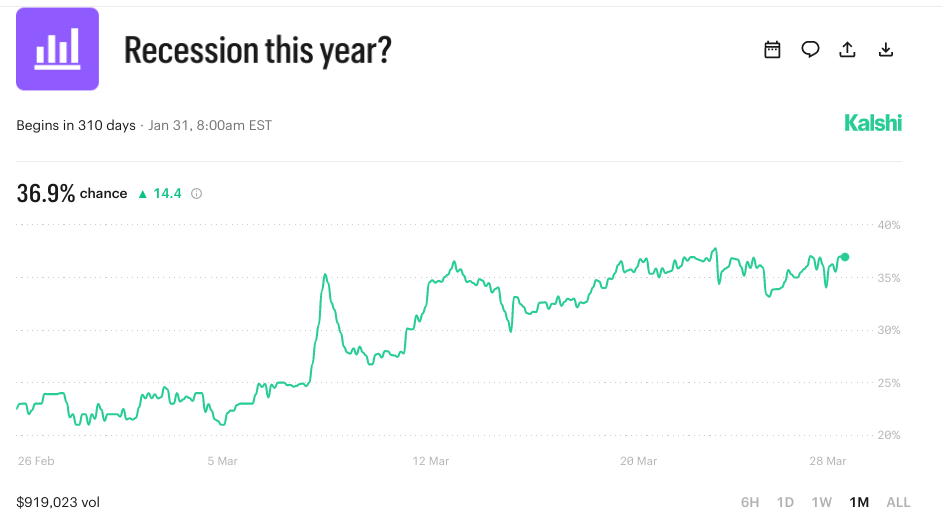
Looking more closely at the betting trend, the line spiked between March 5 and 7.
In two to three days, the probability climbed from roughly 24% to nearly 38%.
Prediction markets move in gradual increments when information accumulates slowly. They spike when a single piece of information abruptly changes the trend in probability.
The timing of that spike coincides with a period of significant tariff escalation announcements and the emergence of Goldman Sachs’s revised recession assessment in market circulation.
What followed the spike is equally important.
The probability pulled back to approximately 27-28% within a few days. But the retreat did not hold.
From mid-March onward, the line climbed back steadily and has traded consistently above 33% through the final two weeks of the chart period, closing at 36.9% on March 28.
Markets that spike, partially retreat, and then establish a new stable floor signal a genuine reassessment of underlying conditions.
Goldman at 30%, the Market at 37%
Goldman Sachs has raised its U.S. recession probability to 30%, a threshold the bank described as moving recession from a tail-risk scenario to a realistic event requiring portfolio adjustments.
Three factors drove the revision:
- Policy uncertainty
- Sticky inflation
- External shocks.
Policy uncertainty is driven primarily by the unpredictable trajectory of U.S. tariff policy.
Sticky inflation is Goldman’s second factor and its most constraining one.
In a standard cyclical downturn, the Federal Reserve cuts interest rates to stimulate borrowing, investment, and consumption. That is the primary tool in the recession-fighting toolkit.
If inflation remains elevated, the Fed’s ability to deploy that tool is limited.
External shocks, which are the third driver, are by definition the hardest to model.
They come from outside the variables that quantitative frameworks are built to price.
Geopolitical disruptions, energy price volatility, and sudden trade flow impacts all fall into this category.
What One in Three Actually Means
The framing of a probability matters as much as its precise value.
At 36.9%, the Kalshi market is describing a roughly one-in-three chance of recession.
That specific framing carries behavioural weight that smaller probabilities do not.
For example:
- A 10% probability is a tail risk (something to note but not act on in most circumstances).
- A 20% probability is elevated but still comfortably in the minority outcome.
A 36.9% probability is one in three. At that level, rational economic actors begin adjusting behaviour without waiting for certainty.
Lenders tighten credit standards. Businesses defer discretionary spending and extend hiring timelines.
Consumers increase their savings rate. Investors reduce equity exposure and build cash positions.
So, what now?
Q1 2026 GDP preliminary estimates are typically published by the Bureau of Economic Analysis in late April.
If Q1 comes in negative, the clock starts.
A second consecutive negative quarter would need to be confirmed from Q2 2026 data, published in late July.
An official “Yes” resolution on the contract could therefore come as early as late July or August 2026 if the economic deterioration that Goldman and the prediction market are pricing is already underway.
Sources:
Kalshi Prediction Market (captured March 28, 2026) | Goldman Sachs U.S. Economic Outlook