How much do you think the average person spends when they order stuff online?
Global e-commerce giant Dynamic Yield says it’s $154 across all industries in 2025.
This is what is called Average Order Value (AOV). It’s a key metric that measures the average amount customers spend per transaction.
TL;DR
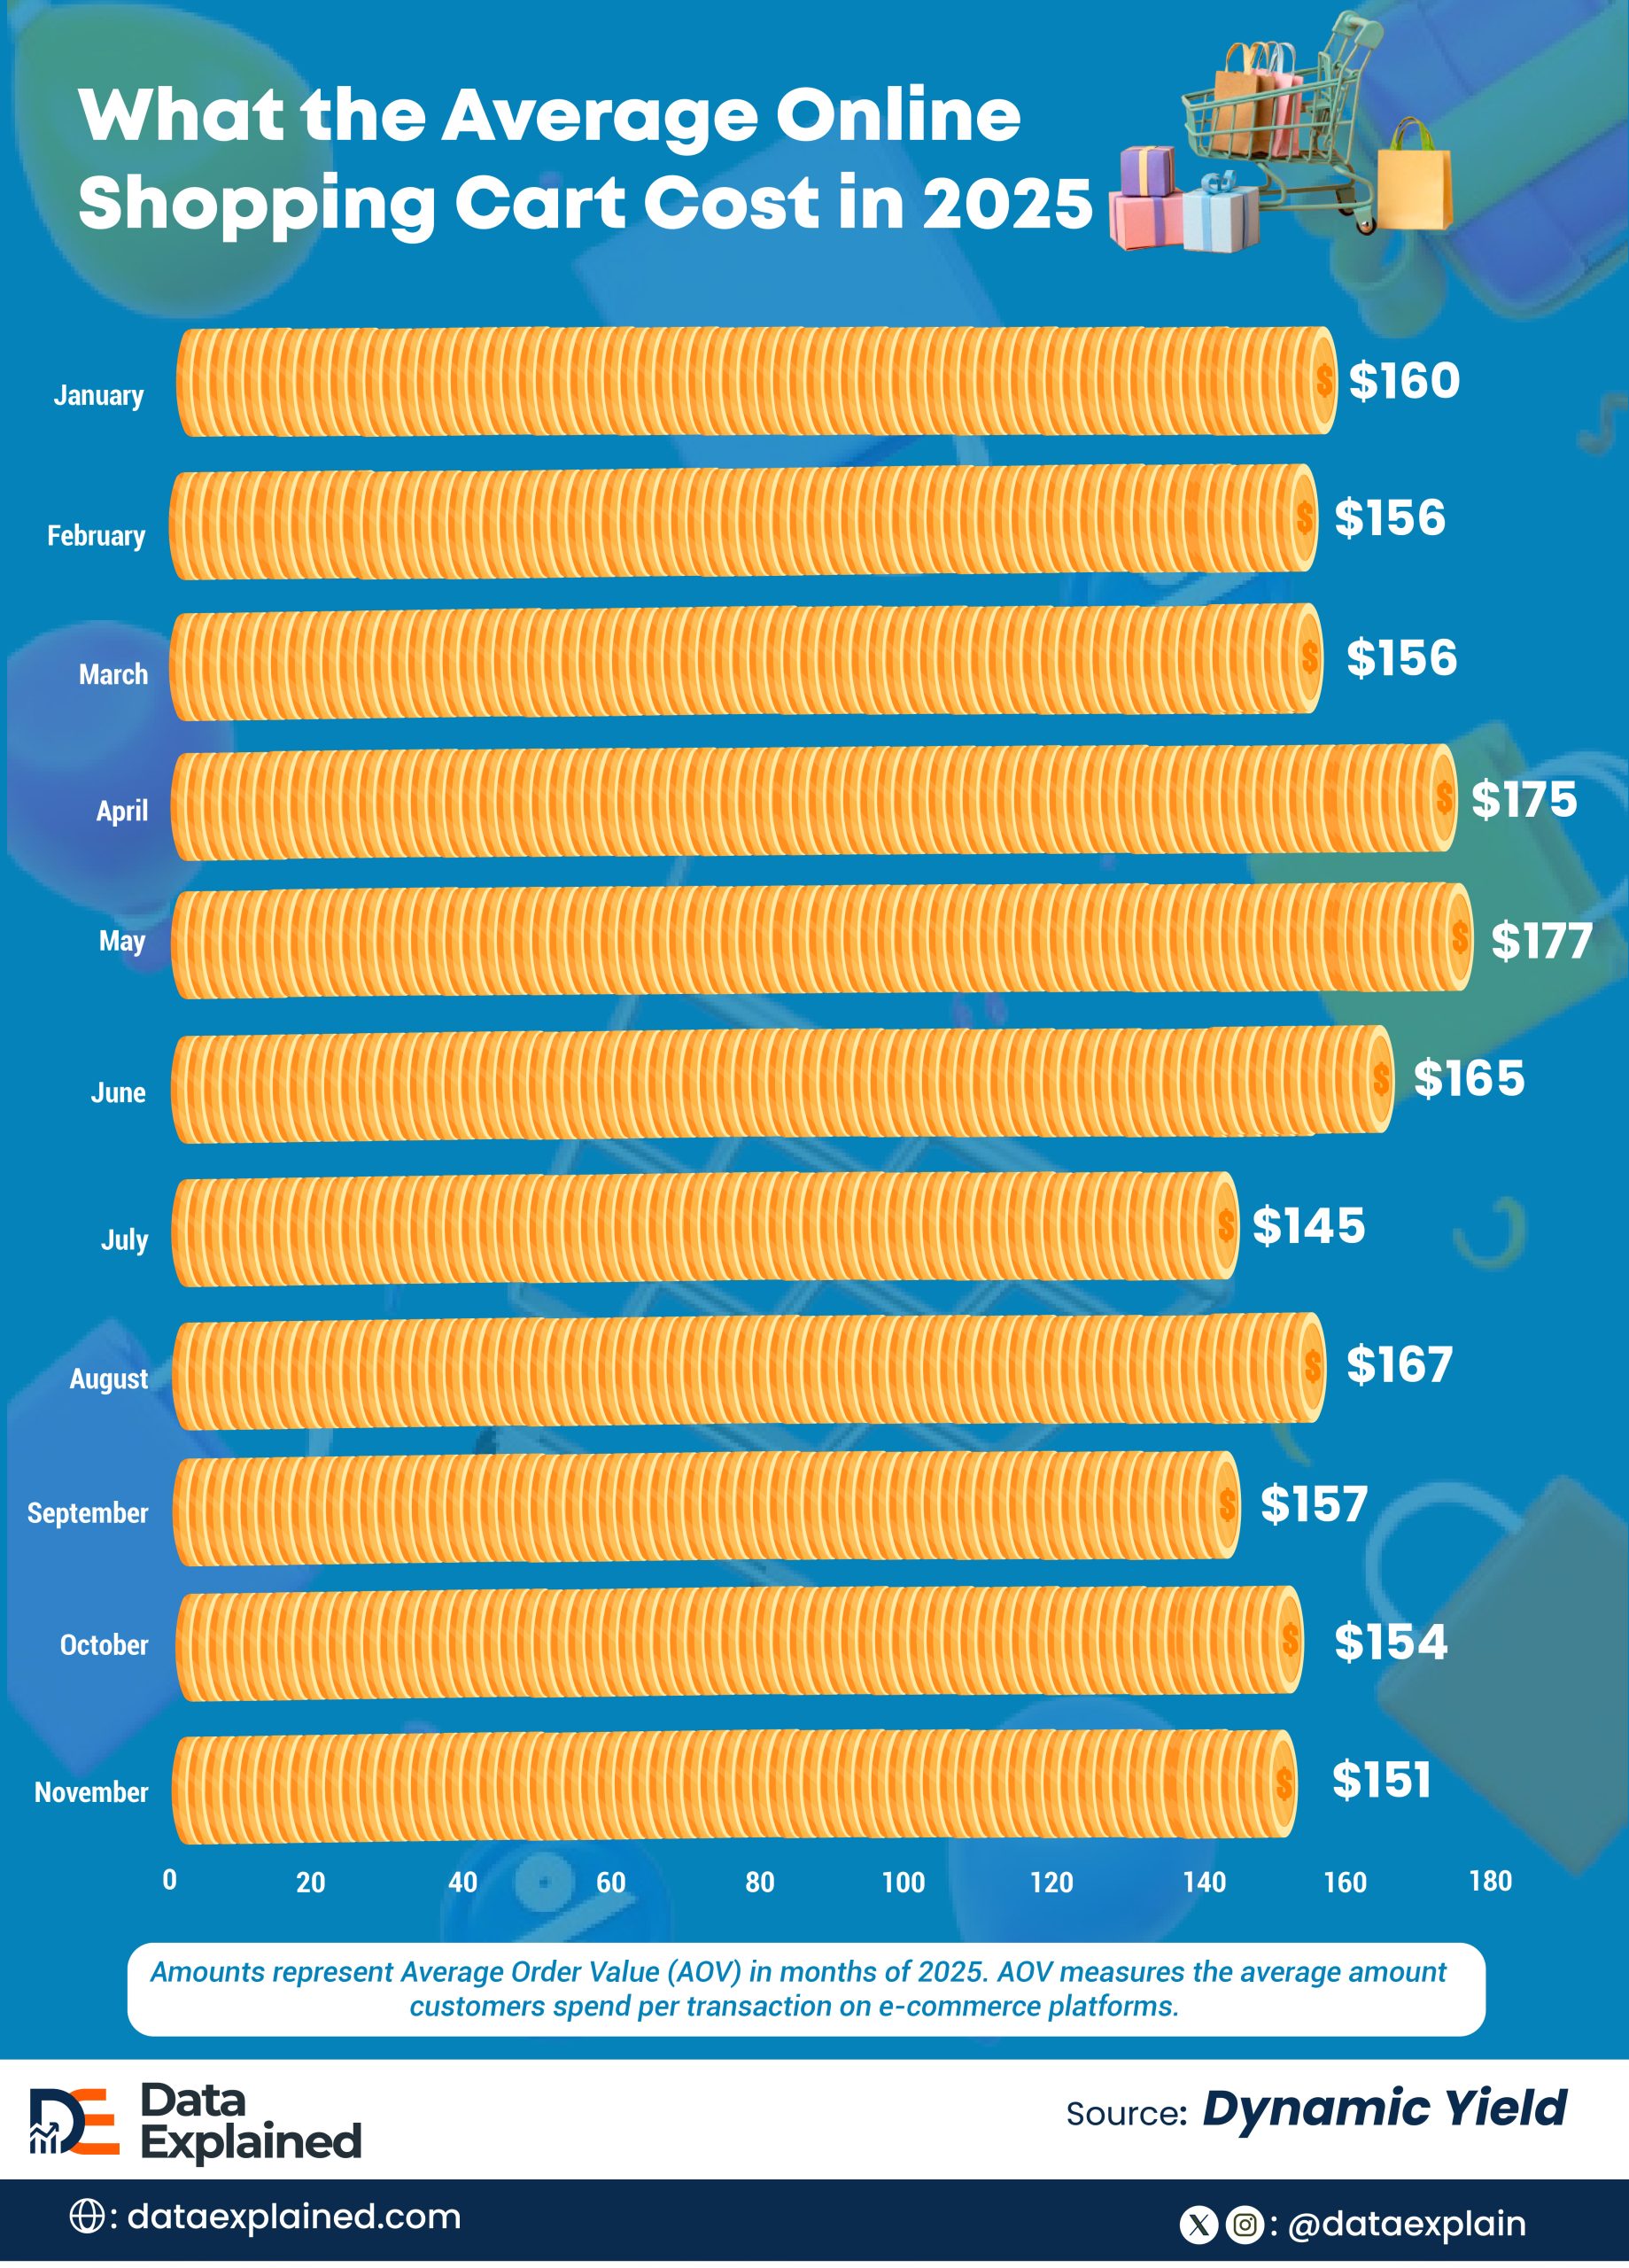
- Throughout 2025, April and May saw the highest AOV due to seasonal promotion or pre-summer shopping.
- On an industry basis, “consumer goods” have the highest AOV, as they include expensive purchases such as appliances and household equipment.
Today’s visualisation shows the average amount people globally spend on e-commerce purchases per month, based on Dynamic Yield data.
The platform compiles anonymized e-commerce transaction data to analyze average order value trends across industries.
The table below shows the average order value by Month in 2025.
| wdt_ID | wdt_created_by | wdt_created_at | wdt_last_edited_by | wdt_last_edited_at | Month (2025) | Average Order Value (USD) |
|---|---|---|---|---|---|---|
| 1 | Monica Ebunoluwa | 23/01/2026 03:28 PM | Monica Ebunoluwa | 23/01/2026 03:28 PM | January | 160 |
| 2 | Monica Ebunoluwa | 23/01/2026 03:28 PM | Monica Ebunoluwa | 23/01/2026 03:28 PM | February | 156 |
| 3 | Monica Ebunoluwa | 23/01/2026 03:28 PM | Monica Ebunoluwa | 23/01/2026 03:28 PM | March | 156 |
| 4 | Monica Ebunoluwa | 23/01/2026 03:28 PM | Monica Ebunoluwa | 23/01/2026 03:28 PM | April | 175 |
| 5 | Monica Ebunoluwa | 23/01/2026 03:28 PM | Monica Ebunoluwa | 23/01/2026 03:28 PM | May | 177 |
| 6 | Monica Ebunoluwa | 23/01/2026 03:28 PM | Monica Ebunoluwa | 23/01/2026 03:28 PM | June | 165 |
| 7 | Monica Ebunoluwa | 23/01/2026 03:28 PM | Monica Ebunoluwa | 23/01/2026 03:28 PM | July | 145 |
| 8 | Monica Ebunoluwa | 23/01/2026 03:28 PM | Monica Ebunoluwa | 23/01/2026 03:28 PM | August | 167 |
| 9 | Monica Ebunoluwa | 23/01/2026 03:28 PM | Monica Ebunoluwa | 23/01/2026 03:28 PM | September | 157 |
| 10 | Monica Ebunoluwa | 23/01/2026 03:28 PM | Monica Ebunoluwa | 23/01/2026 03:28 PM | October | 154 |
Surprisingly, November’s average order value of $151 should mark peak holiday spending, yet it’s 15% below May’s AOV.
Prime Day 2025 saw 39% of shoppers spend less than in previous years, with just 28% spending more.
This means that traditional holiday shopping patterns are broken.
The “Research, Don’t Buy” Economy
Clicks increased 18%, and orders rose 12%, yet consumer spending grew just 0.4%, with conversion rates declining 5% and average order value falling 10% impact.
People are browsing but not buying (or buying cheaper alternatives).
Also, purchase journeys extended significantly as consumers moved toward longer research periods and more deliberate purchasing impact.
The $160+ AOVs (between January and May) represented confident buying; the $145-$154 range (between July and November) shows extreme price sensitivity.
Temu/Shein Hit Hardest
Interestingly, average order value trends also reflect the revenue e-commerce giants are generating.
For example, China shipments were no longer eligible for de minimis treatment as of May 2, 2025.
So, the July AOV crash ($145) coincides exactly with this.
Ultra-cheap Chinese e-commerce lost its pricing advantage overnight. This explains the summer collapse.
With Amazon claiming 37.6% of the U.S. e-commerce market, its scale allows it to absorb tariff costs that competitors can’t. The AOV decline crushes smaller DTC brands while Amazon’s marketplace model diversifies risk.
Meanwhile, according to the Dynamic Yield database, desktop orders average $146.05 while mobile orders average just $112, yet mobile drives most traffic.
Lower AOVs are partly a device shift. In other words, stressed consumers compare shop on phones, driving down cart values.
People Spend More Online For Consumer Goods, Anyway
| wdt_ID | wdt_created_by | wdt_created_at | wdt_last_edited_by | wdt_last_edited_at | Industry | Average Order Value in 2025 (Jan-Nov) |
|---|---|---|---|---|---|---|
| 1 | Monica Ebunoluwa | 23/01/2026 02:33 PM | Monica Ebunoluwa | 23/01/2026 02:38 PM | Consumer Goods | 296 |
| 2 | Monica Ebunoluwa | 23/01/2026 02:33 PM | Monica Ebunoluwa | 23/01/2026 02:38 PM | Home and Furniture | 264 |
| 3 | Monica Ebunoluwa | 23/01/2026 02:33 PM | Monica Ebunoluwa | 23/01/2026 02:39 PM | Luxury and Jewelry | 253 |
| 4 | Monica Ebunoluwa | 23/01/2026 02:33 PM | Monica Ebunoluwa | 23/01/2026 02:45 PM | Food and Beverage | 84 |
| 5 | Monica Ebunoluwa | 23/01/2026 02:33 PM | Monica Ebunoluwa | 23/01/2026 02:45 PM | Multi-Brand Retail | 117 |
| 6 | Monica Ebunoluwa | 23/01/2026 02:33 PM | Monica Ebunoluwa | 23/01/2026 02:46 PM | Beauty and Personal Care | 74 |
| 7 | Monica Ebunoluwa | 23/01/2026 02:33 PM | Monica Ebunoluwa | 23/01/2026 02:46 PM | Pet Care and Veterinary Services | 66 |
| 8 | Monica Ebunoluwa | 23/01/2026 02:33 PM | Monica Ebunoluwa | 23/01/2026 02:46 PM | Fashion, Accessories, and Apparel | 149 |
| 9 | Monica Ebunoluwa | 23/01/2026 02:37 PM | Monica Ebunoluwa | 23/01/2026 02:37 PM | ||
| 10 | Monica Ebunoluwa | 23/01/2026 02:38 PM | Monica Ebunoluwa | 23/01/2026 02:38 PM |
From the table above, Consumer Goods has the highest AOV at $296.
This is because this category primarily includes big-ticket items such as electronics, appliances, and household equipment. These purchases are more expensive, which raises the average order value.
.
Home & Furniture and Luxury & Jewelry sit near the top, because they have high unit cost, increasing the AOV at a go.
On the other end, categories like Pet Care and Beauty & Personal Care naturally have lower AOVs, because they mainly sell lower-priced treats and grooming items.
AI Could Have a Hand in All These…
Adobe Analytics showed AI-driven e-commerce traffic up 1,200% in early 2025 compared to six months earlier, yet AOV still fell.
This means that more engagement and less spending come from window shopping with AI assistants.
Meanwhile, according to the Penn Wharton Budget Model, Trump’s proposed tariffs could shrink long-run U.S. GDP by 6% and lower average wages by 5%, costing a middle-income household an estimated $22,000 in lifetime income.
About 68% of Americans live paycheck to paycheck, with the top 10% of earners now accounting for 49.2% of total consumer spending (the highest level since 1989, according to Cascade Partners).
AOV decline could also signal a middle-class collapse since the wealthy are still able to spend freely.
ELI5: Average Order Value in 2025
In early 2025, people spent more per online order in April and May, primarily because of big seasonal promotions and pre-summer shopping, as these are times when shoppers tend to buy more expensive or bulk items. This naturally pushes the average amount higher during those months.
Across industries, consumer goods have the highest AOV because they include big-ticket items such as home appliances, electronics, and household equipment. These cost more per purchase than everyday products, which skews the overall average.
Source:
Dynamic yield | Money | Retail Brew | Impact | GOFTX | US Chamber of Commerce
*While the dataset is global, Dynamic Yield’s client base is described as “principally composed of mid-sized to large retailers,” including many major US brands, eMarketer, so there may be a Western/US skew even though it’s technically global data.