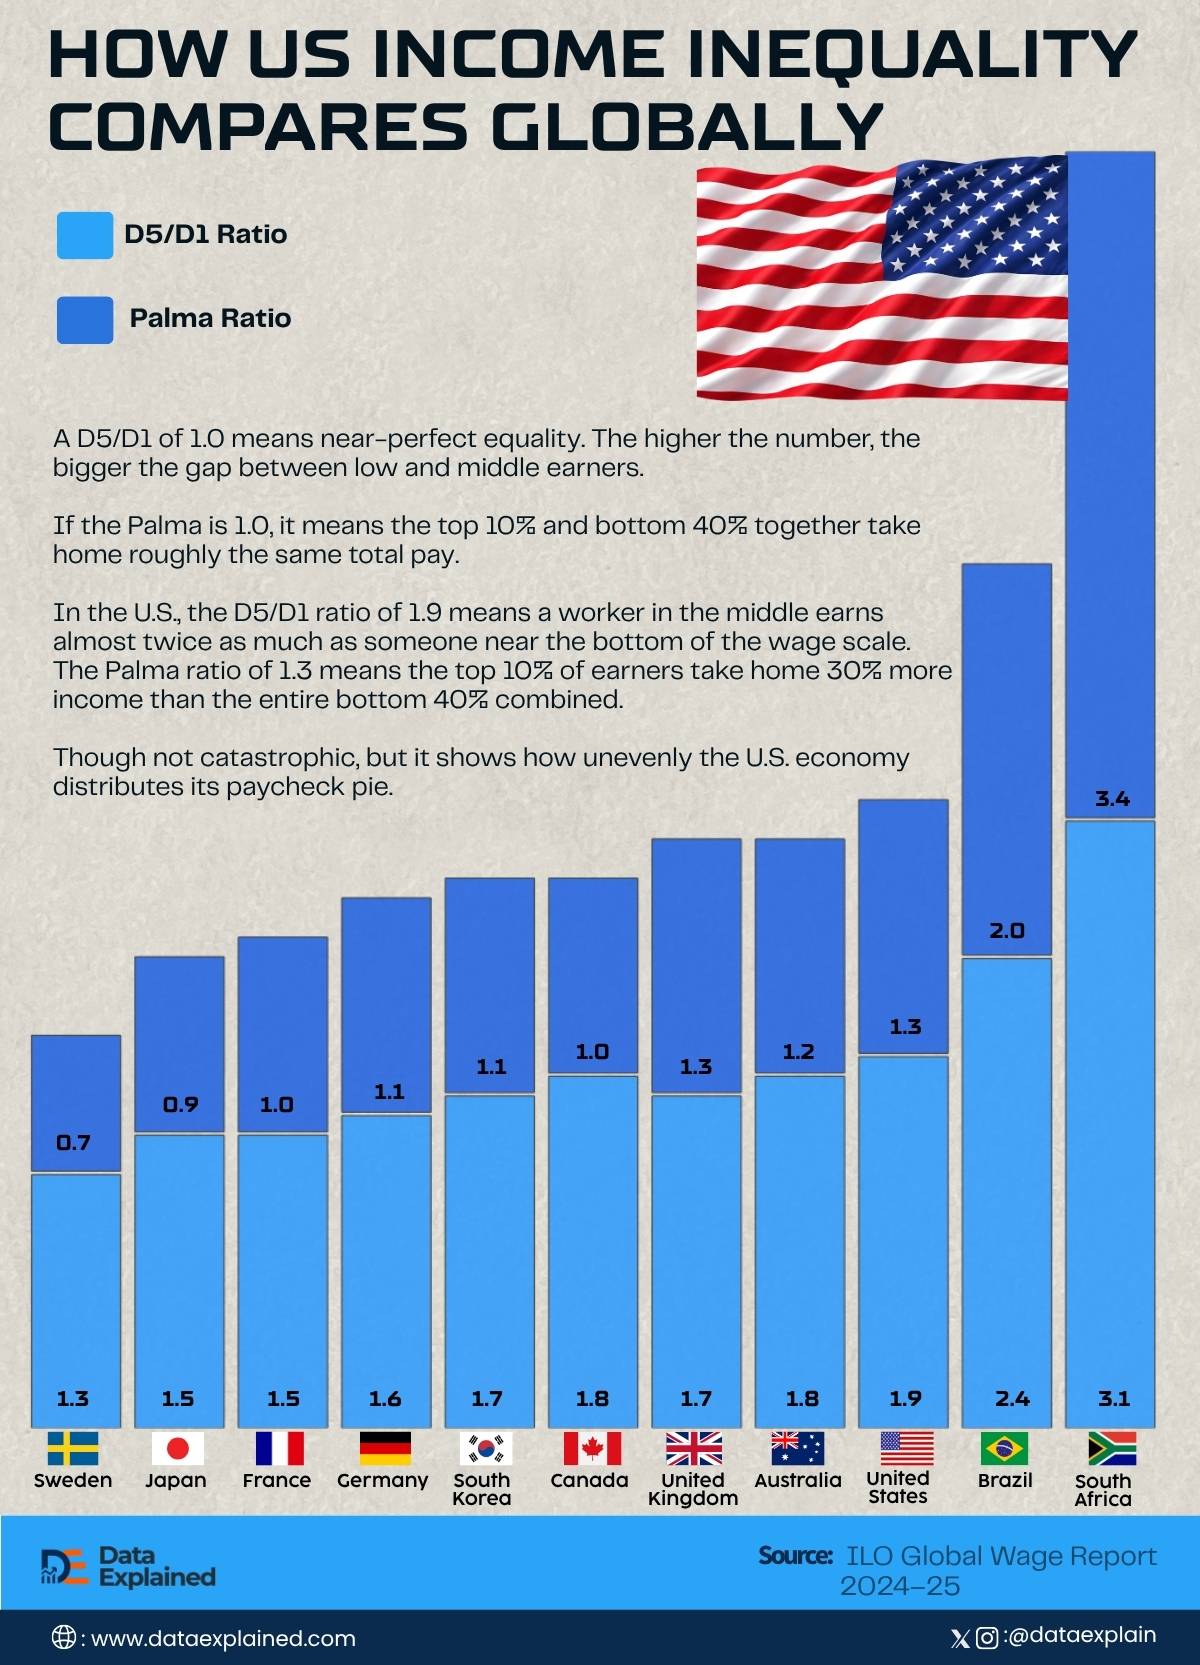
By most global measures, the United States doesn’t have the worst wage inequality in the world, but it’s far from equal.
The latest International Labor Organization (ILO) Global Wage Report 2024–25 presents a picture of a country where middle- and lower-income earners are slowly falling behind, even as the overall economy continues to grow.
TL;DR
- The top 10% of earners in the U.S. take home 30% more income than the entire bottom 40% combined.
- Income inequality in the U.S. remains among the highest in advanced economies.
- From a global outlook, Sweden has one of the best income equality metrics.
Understanding The Basics
The ILO uses two simple measures to compare wage inequality across countries:
- D5/D1 ratio: This indicates how much a typical middle-income worker (the median) earns compared to someone near the bottom (the top 10% of the lowest earners).
- Palma ratio: This compares the total wages of the wealthiest 10% of workers to the combined wages of the bottom 40%.
A D5/D1 of 1.0 means near-perfect equality. The higher the number, the bigger the gap between low and middle earners.
If the Palma is 1.0, it means the top 10% and bottom 40% together take home roughly the same total pay.
The higher the number, the greater the top 10%’s share of the national wage bill.
How the U.S. Compares
Here’s how the U.S. stacks up against 10 other major economies:
| wdt_ID | wdt_created_by | wdt_created_at | wdt_last_edited_by | wdt_last_edited_at | Country | D5/D1 Ratio | Palma Ratio | Meaning |
|---|---|---|---|---|---|---|---|---|
| 1 | Monica Ebunoluwa | 31/07/2026 10:06 AM | Monica Ebunoluwa | 31/07/2026 10:06 AM | United States | 1.9 | 1.3 | Moderate inequality |
| 2 | Monica Ebunoluwa | 31/07/2026 10:06 AM | Monica Ebunoluwa | 31/07/2026 10:06 AM | Canada | 1.8 | 1.0 | More equal |
| 3 | Monica Ebunoluwa | 31/07/2026 10:06 AM | Monica Ebunoluwa | 31/07/2026 10:06 AM | United Kingdom | 1.7 | 1.3 | Similar to U.S. |
| 4 | Monica Ebunoluwa | 31/07/2026 10:06 AM | Monica Ebunoluwa | 31/07/2026 10:06 AM | France | 1.5 | 1.0 | Fairly equal |
| 5 | Monica Ebunoluwa | 31/07/2026 10:06 AM | Monica Ebunoluwa | 31/07/2026 10:06 AM | Germany | 1.6 | 1.1 | Moderate inequality |
| 6 | Monica Ebunoluwa | 31/07/2026 10:06 AM | Monica Ebunoluwa | 31/07/2026 10:06 AM | Sweden | 1.3 | 0.7 | One of the most equal |
| 7 | Monica Ebunoluwa | 31/07/2026 10:06 AM | Monica Ebunoluwa | 31/07/2026 10:06 AM | Australia | 1.8 | 1.2 | Similar to U.S. |
| 8 | Monica Ebunoluwa | 31/07/2026 10:06 AM | Monica Ebunoluwa | 31/07/2026 10:06 AM | Japan | 1.5 | 0.9 | More balanced |
| 9 | Monica Ebunoluwa | 31/07/2026 10:06 AM | Monica Ebunoluwa | 31/07/2026 10:06 AM | South Korea | 1.7 | 1.1 | Slightly better balance |
| 10 | Monica Ebunoluwa | 31/07/2026 10:06 AM | Monica Ebunoluwa | 31/07/2026 10:06 AM | Brazil | 2.4 | 2.0 | High inequality |
Based on the ILO Global Wage Report 2024–25
In the U.S., the D5/D1 ratio of 1.9 means a worker in the middle earns almost twice as much as someone near the bottom of the wage scale.
The Palma ratio of 1.3 means the top 10% of earners take home 30% more income than the entire bottom 40% combined.
That’s not catastrophic, but it shows how unevenly the U.S. economy distributes its paycheck pie.
By contrast, in Sweden, the Palma ratio is 0.7, meaning the bottom 40% earn more in total than the top 10%.
Meanwhile, South Africa’s Palma of 3.4 means its top 10% earn more than three times what the bottom 40% take home, a massive gulf.
The Global Context
Globally, the ILO reports that two-thirds of countries have seen a decline in wage inequality since 2000.
The primary reasons for this are stronger minimum wages, improved collective bargaining, and wage policies targeting lower earners.
But the U.S. remains stuck in the middle of the inequality ladder, more divided than most of Europe, but fairer than many emerging economies.
It’s the classic “rich but uneven” profile. That is, a high-income nation with a deeply segmented wage structure.
According to the Census Bureau, American Community, the U.S. overall median full-time salary sits at approximately $61,702 per year, though the gap between the highest and lowest earning states exceeds $50,000.
Income Inequality Trend in the U.S. (2015-2023)
To illustrate the evolution of income inequality in the U.S., data were compiled from the U.S. Census Bureau and the ILO Global Wage Report.
| wdt_ID | wdt_created_by | wdt_created_at | wdt_last_edited_by | wdt_last_edited_at | Year | Gini Index (0–100) | Change from Previous Year |
|---|---|---|---|---|---|---|---|
| 1 | Monica Ebunoluwa | 31/07/2026 10:16 AM | Monica Ebunoluwa | 31/07/2026 10:16 AM | 2015 | 41.0 | — |
| 2 | Monica Ebunoluwa | 31/07/2026 10:16 AM | Monica Ebunoluwa | 31/07/2026 10:19 AM | 2016 | 41.2 | +0.2 |
| 3 | Monica Ebunoluwa | 31/07/2026 10:16 AM | Monica Ebunoluwa | 31/07/2026 10:20 AM | 2017 | 41.5 | +0.3 |
| 4 | Monica Ebunoluwa | 31/07/2026 10:16 AM | Monica Ebunoluwa | 31/07/2026 10:20 AM | 2018 | 41.7 | +0.2 |
| 5 | Monica Ebunoluwa | 31/07/2026 10:16 AM | Monica Ebunoluwa | 31/07/2026 10:20 AM | 2019 | 41.9 | +0.2 |
| 6 | Monica Ebunoluwa | 31/07/2026 10:16 AM | Monica Ebunoluwa | 31/07/2026 10:16 AM | 2020 | 41.6 | -0.3 |
| 7 | Monica Ebunoluwa | 31/07/2026 10:16 AM | Monica Ebunoluwa | 31/07/2026 10:21 AM | 2021 | 41.8 | +0.2 |
| 8 | Monica Ebunoluwa | 31/07/2026 10:16 AM | Monica Ebunoluwa | 31/07/2026 10:21 AM | 2022 | 41.9 | +0.1 |
| 9 | Monica Ebunoluwa | 31/07/2026 10:16 AM | Monica Ebunoluwa | 31/07/2026 10:17 AM | 2023 | 41.8 | -0.1 |
The Gini Index indicates that income inequality in the U.S. increased steadily between 2015 and 2019, reaching one of its highest levels in decades.
The slight dip in 2020 reflects temporary income supports and labor disruptions during the pandemic.
However, inequality resumed a mild upward trend from 2021 onward, stabilizing around 41.8 by 2023.
Between 2000 and 2023, wages for low-income Americans grew at a rate slower than inflation.
The inflation rate has moved from 3.4 to 2.9 over the past 23 years.
Adjusted for cost of living, the bottom 20% of wage earners have lost purchasing power, even as average productivity has risen.
Meanwhile, CEO and top 1% earnings have skyrocketed.
Major Drivers of Income Inequality Trends
Income inequality in the U.S. reflects overlapping structural and economic factors.
Four major forces are driving the current gap.
First is wage polarization. High earners in tech and finance continue to see large gains, while low- and mid-wage workers experience stagnation.
According to the Bureau of Labor Statistics, in May 2024, the average U.S. annual income for:
- Computer and Information Technology occupations was about $105,990
- Financial and Investment Analysts was approximately $101,350
Secondly, declining union strength has weakened collective bargaining, reducing wage equity. Weaker wage-setting systems widen pay gaps across gender and industries.
Third, capital income growth favors the wealthy. A rising share of U.S. income now comes from profits and investments rather than wages, and returns on capital continue to outpace earnings.
Lastly, automation and technology deepen skill-based inequality. High-skilled workers benefit the most, while low-skilled roles face pressure on pay or replacement.
What to Watch Ahead: Projections Based on Current Data
The upper-tail compression seen between 2006 and 2021 (where high earners’ wages grew more slowly than before) may continue.
However, the bottom half of the distribution is still unlikely to catch up without targeted interventions.
Rising automation and the expansion of AI-driven sectors are also likely to reshape wage structures.
While high-skill digital workers may benefit, lower-wage service and manual jobs could experience stagnant pay.
The OECD expects inequality to plateau rather than fall, with modest policy reforms insufficient to close the gap.
ELI5: Is It All Bad News?
Not entirely. The U.S. still boasts one of the highest average wage levels in the world, and some inequality is expected in a competitive, innovation-driven economy.
But what’s clear from the data is that income gains are unevenly distributed (and that’s the core challenge).
When the bottom 40% struggle while the top 10% accumulate wealth faster, it limits social mobility and weakens consumer spending.
Sources: