The 1994 FIFA World Cup, hosted by the United States, recorded an average attendance of 68,991 per match.
That figure has not been matched, approached, or broken by any of the seven tournaments staged in the 32 years since.
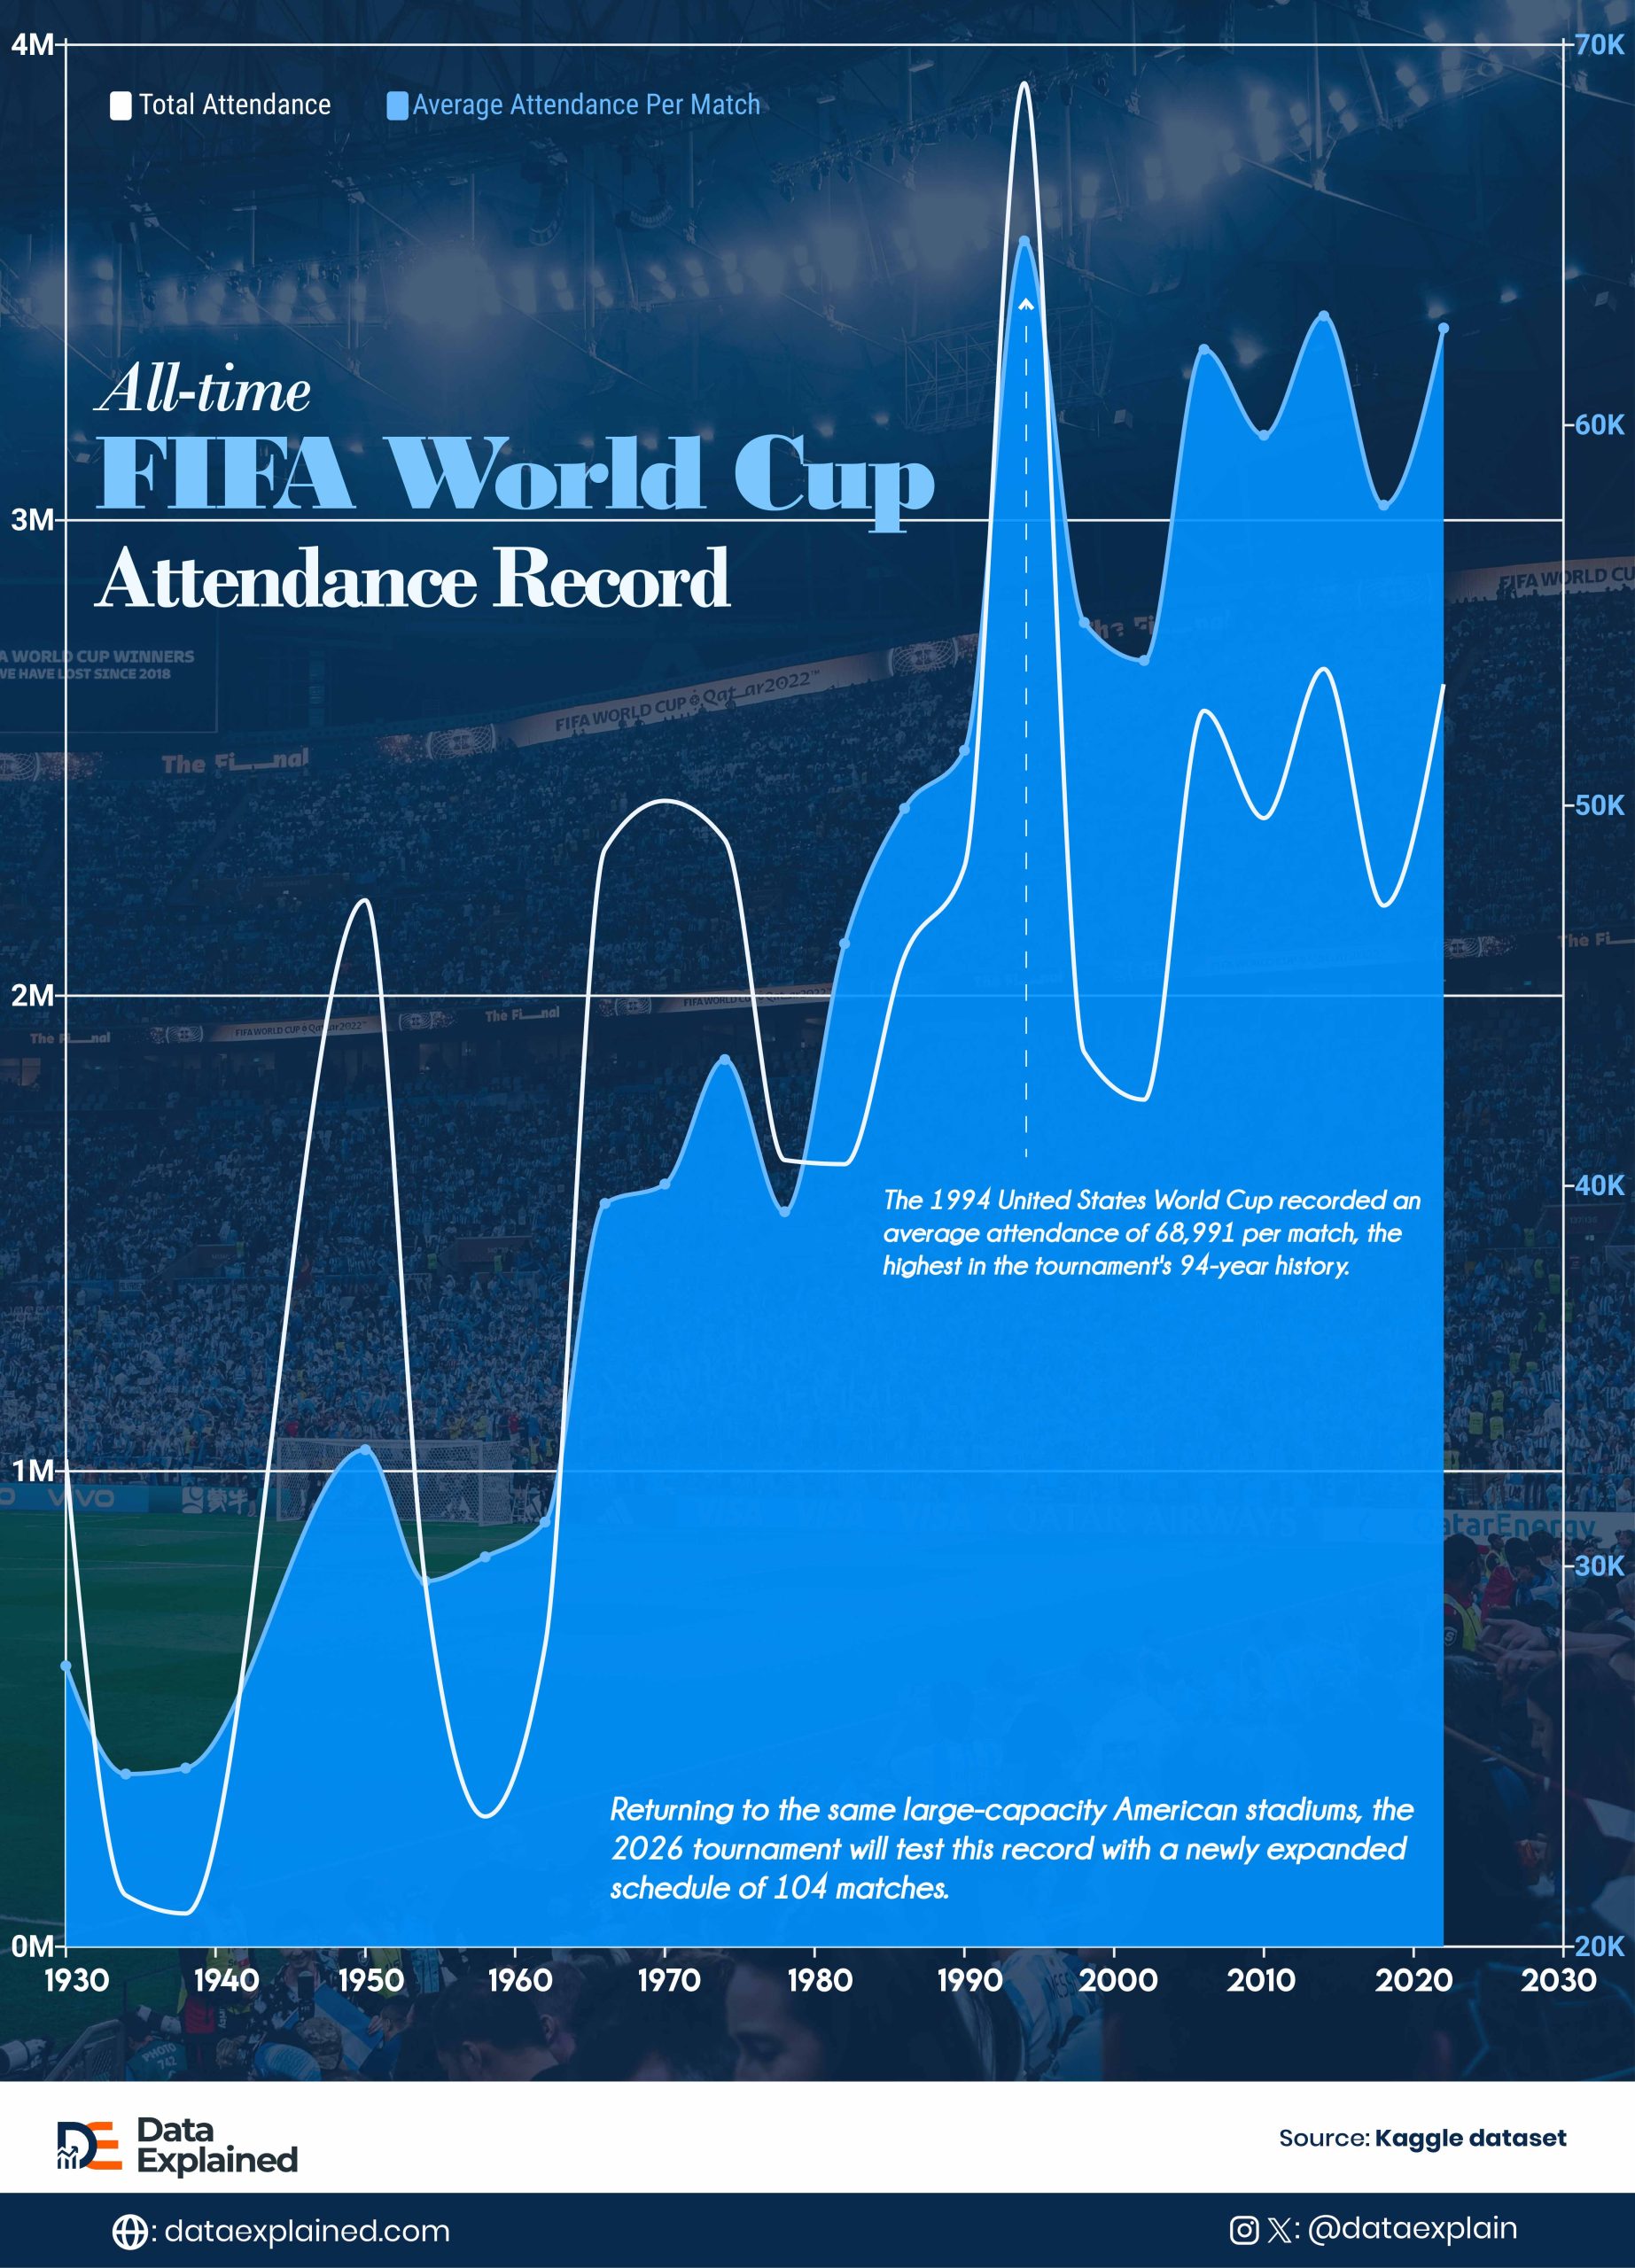
The infographic above shows World Cup Attendance from 1930 to 2026.
It was harvested from a Kaggle dataset covering every World Cup from 1930 to 2022.
The 2026 World Cup, returning to the same US venues that produced that record, opens the question of whether it can finally be broken.
TL;DR
- The 1994 United States World Cup recorded an average attendance of 68,991 per match, the highest in the tournament’s 94-year history
- The 2026 World Cup returns to the same U.S. venues that produced the 1994 record, now staging 104 matches compared to 1994’s 52
ALSO READ: FIFA Says World Cup Will Add $17B to US Economy; Here’s Where The Money Goes
| wdt_ID | wdt_created_by | wdt_created_at | wdt_last_edited_by | wdt_last_edited_at | Year | Hosts | Total Attendance | Matches | Average Attendance per match |
|---|---|---|---|---|---|---|---|---|---|
| 1 | emmanuel-ashemiriogwa | 20/06/2026 04:33 PM | emmanuel-ashemiriogwa | 20/06/2026 04:33 PM | 1930 | Uruguay | 590,549 | 18 | 32,808 |
| 2 | emmanuel-ashemiriogwa | 20/06/2026 04:33 PM | emmanuel-ashemiriogwa | 20/06/2026 04:33 PM | 1934 | Italy | 363,000 | 17 | 21,353 |
| 3 | emmanuel-ashemiriogwa | 20/06/2026 04:33 PM | emmanuel-ashemiriogwa | 20/06/2026 04:33 PM | 1938 | France | 375,700 | 18 | 20,872 |
| 4 | emmanuel-ashemiriogwa | 20/06/2026 04:33 PM | emmanuel-ashemiriogwa | 20/06/2026 04:33 PM | 1950 | Brazil | 1,045,246 | 22 | 47,511 |
| 5 | emmanuel-ashemiriogwa | 20/06/2026 04:33 PM | emmanuel-ashemiriogwa | 20/06/2026 04:33 PM | 1954 | Switzerland | 768,607 | 26 | 29,562 |
| 6 | emmanuel-ashemiriogwa | 20/06/2026 04:33 PM | emmanuel-ashemiriogwa | 20/06/2026 04:33 PM | 1958 | Sweden | 819,810 | 35 | 23,423 |
| 7 | emmanuel-ashemiriogwa | 20/06/2026 04:33 PM | emmanuel-ashemiriogwa | 20/06/2026 04:33 PM | 1962 | Chile | 893,172 | 32 | 27,912 |
| 8 | emmanuel-ashemiriogwa | 20/06/2026 04:33 PM | emmanuel-ashemiriogwa | 20/06/2026 04:33 PM | 1966 | England | 1,563,135 | 32 | 48,848 |
| 9 | emmanuel-ashemiriogwa | 20/06/2026 04:33 PM | emmanuel-ashemiriogwa | 20/06/2026 04:33 PM | 1970 | Mexico | 1,603,975 | 32 | 50,124 |
| 10 | emmanuel-ashemiriogwa | 20/06/2026 04:33 PM | emmanuel-ashemiriogwa | 20/06/2026 04:33 PM | 1974 | West Germany | 1,865,753 | 38 | 49,099 |
Why the U.S. Produced the Record
The mechanism is specific.
The 1994 tournament was staged in American football stadiums built to hold 70,000 to 100,000 people, capacities that no European or South American host has deployed at an equivalent scale before or since.
Stanford Stadium, the Rose Bowl, the Silverdome, the Pontiac Stadium, and Giants Stadium provided seating that European hosts simply did not have available.
The 52 matches of 1994 produced a total attendance of 3,587,538.
That figure held as the total record until Germany 2006 (3,359,439 across 64 matches, still lower) and was eventually surpassed by Brazil 2014 (3,429,873 across 64 matches) and Qatar 2022 (3,404,252 across 64 matches).
But no tournament has produced the 1994 average.
ALSO READ: Visualized: Stadiums Hosting the Most & Least FIFA World Cup Games
What Happened When the Format Expanded?
In 1998, France added 12 matches to the format, expanding from 52 to 64 games.
The result was approximately 800,000 fewer total attendees than in 1994.
Adding 12 matches reduced total attendance and cut the average to 43,517, which is a decline of 25,474 per game from the US figure.
French stadium capacities were smaller than American NFL venues, and the novelty effect that had partly driven 1994 attendance was absent in a country where football was already the dominant sport.
The same dilution pattern reappeared in 2002 in South Korea and Japan, producing a total of 2,705,197 (the lowest of the 64-match era), with an average of 42,269.
The Tournaments That Did Best
Germany 2006 (52,491 average), Brazil 2014 (53,592), and Qatar 2022 (53,191) are the three closest tournaments to the 1994 benchmark.
And, all remain approximately 15,000 per match below it.
The lowest average in the dataset is for 1938 France, at 20,872 (less than a third of the 1994 US figure).
The lowest total belongs to 1934 Italy, at 363,000 across 17 matches, when Uruguay boycotted the tournament in retaliation for poor European attendance at the inaugural 1930 tournament, and the straight knockout format produced fewer fixtures than any subsequent tournament.
What Will the 2026 Cup Test?
The 2026 FIFA World Cup stages 104 matches (40 more than any previous tournament and exactly double the 52-match format that produced the 1994 record).
The tournament returns to several of the same US cities and the same NFL stadium infrastructure.
The arithmetic is straightforward.
At the 2022 Qatar average of 53,191 per match, 104 games produce approximately 5.532 million total attendees, a new record by nearly 2 million over the current holder.
At 1994-level averages of 68,991, 104 matches produce approximately 7.175 million.
That’s a figure that would exceed every previous tournament combined, bar the largest single-event records in sporting history.
Whether the 2026 average approaches, matches, or breaks the 1994 per-match record is the specific question the dataset poses to the tournament now underway.
ALSO READ: FIFA World Cup: 96 Years of Data Narrows to 3 Realistic Winners
ELI5 (Explain It Like I’m 5)
The 1994 World Cup in the U.S. had the most fans per game of any World Cup ever (almost 69,000 per match). No tournament in the 32 years since has come close. The 2026 World Cup is back in the U.S., using the same big American stadiums, but with 104 games instead of 52. Even if each game attracts fewer fans than in 1994, the total will easily be the highest ever. The question is whether the per-game average finally breaks the 32-year record.
Source: