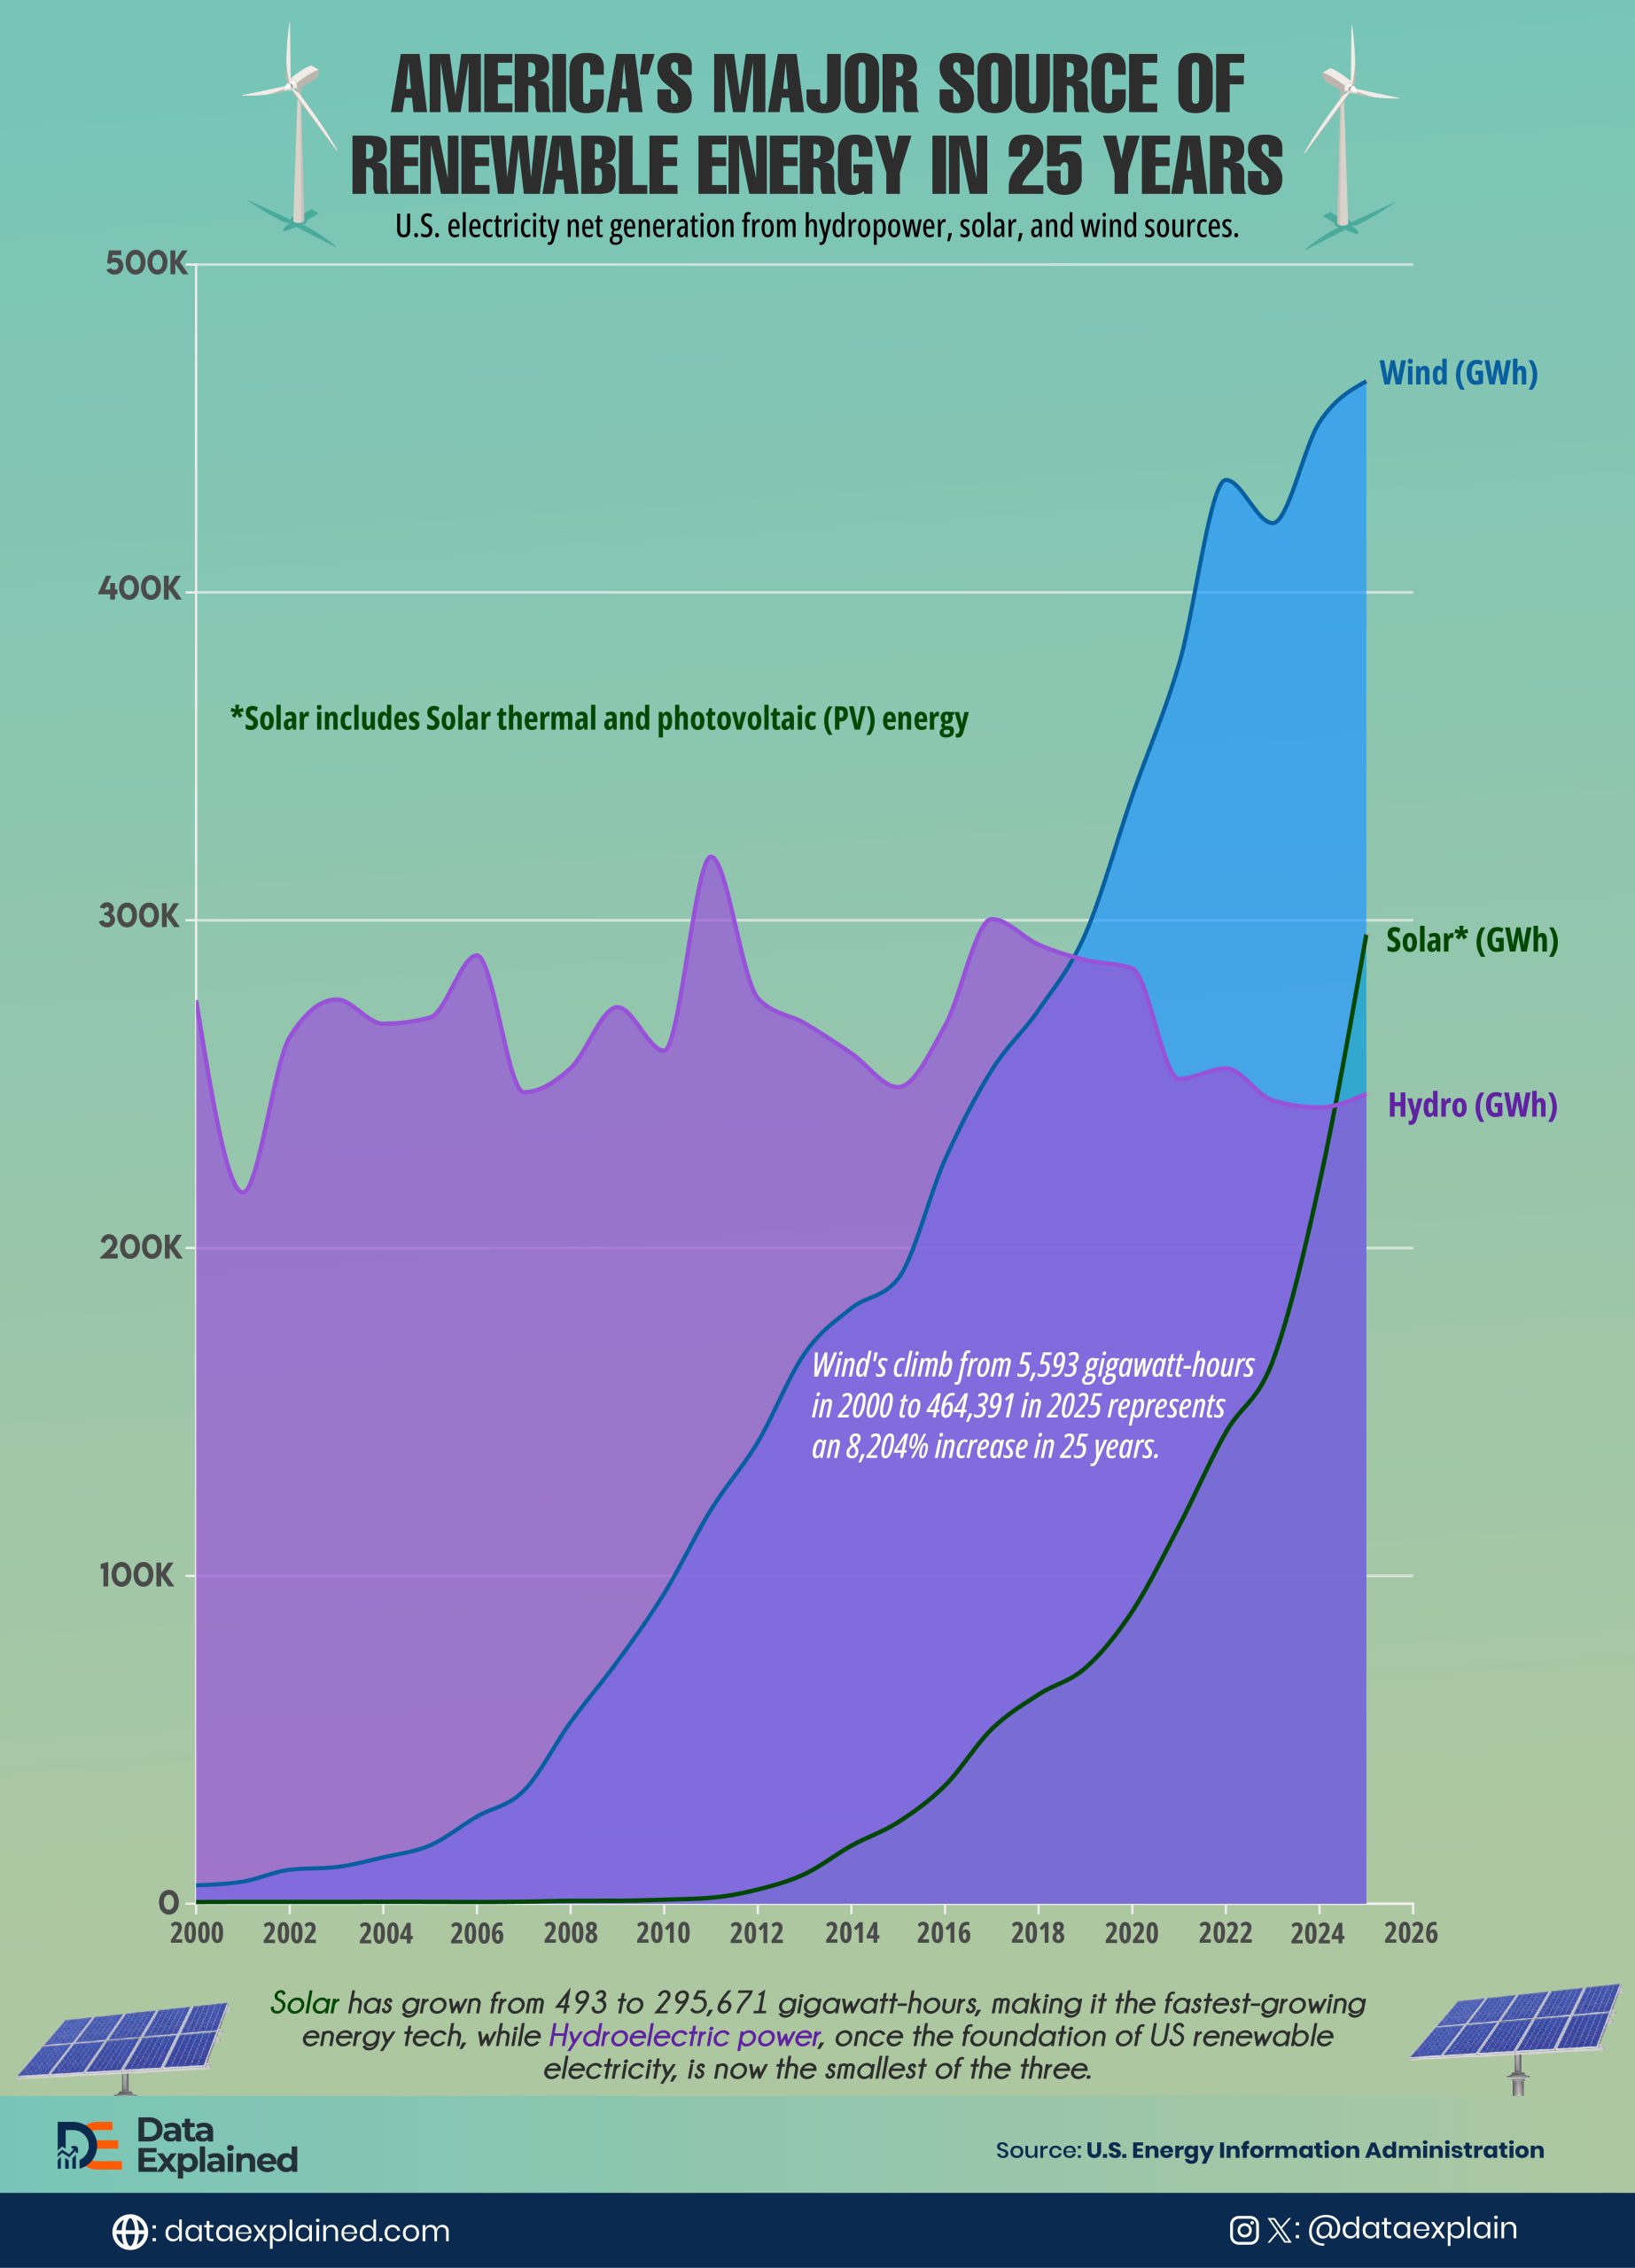
Wind turbines generated more electricity in the United States in 2025 than any other renewable source.
Using data from the U.S. Energy Information Administration, the visual above shows U.S. electricity net generation from hydropower, solar, and wind sources, in gigawatt-hours, from 2000 to 2025.
The 25-year story is one of the most dramatic energy transformations in modern industrial history, and it is still accelerating.
TL;DR
- Wind generated 464,391 gigawatt-hours of US electricity in 2025 — the most of any renewable source
- Solar has grown 59,878% since 2000, from just 493 gigawatt-hours to 295,671 gigawatt-hours, making it the fastest-growing energy technology in the dataset by a wide margin.
- Hydroelectric power, once the foundation of US renewable electricity, is now the smallest of the three sources
| wdt_ID | wdt_created_by | wdt_created_at | wdt_last_edited_by | wdt_last_edited_at | Year | Solar* (GWh) | Wind (GWh) | Hydro (GWh) |
|---|---|---|---|---|---|---|---|---|
| 1 | Monica Ebunoluwa | 03/08/2026 02:35 PM | Monica Ebunoluwa | 03/08/2026 02:35 PM | 2025 | 295,671 | 464,391 | 247,023 |
| 2 | Monica Ebunoluwa | 03/08/2026 02:35 PM | Monica Ebunoluwa | 03/08/2026 02:35 PM | 2024 | 219,834 | 451,904 | 242,896 |
| 3 | Monica Ebunoluwa | 03/08/2026 02:35 PM | Monica Ebunoluwa | 03/08/2026 02:35 PM | 2023 | 165,530 | 421,141 | 245,002 |
| 4 | Monica Ebunoluwa | 03/08/2026 02:35 PM | Monica Ebunoluwa | 03/08/2026 02:35 PM | 2022 | 143,792 | 434,297 | 254,789 |
| 5 | Monica Ebunoluwa | 03/08/2026 02:35 PM | Monica Ebunoluwa | 03/08/2026 02:35 PM | 2021 | 115,258 | 378,197 | 251,585 |
| 6 | Monica Ebunoluwa | 03/08/2026 02:35 PM | Monica Ebunoluwa | 03/08/2026 02:35 PM | 2020 | 89,199 | 337,938 | 285,274 |
| 7 | Monica Ebunoluwa | 03/08/2026 02:35 PM | Monica Ebunoluwa | 03/08/2026 02:35 PM | 2019 | 71,937 | 295,882 | 287,874 |
| 8 | Monica Ebunoluwa | 03/08/2026 02:35 PM | Monica Ebunoluwa | 03/08/2026 02:35 PM | 2018 | 63,825 | 272,667 | 292,524 |
| 9 | Monica Ebunoluwa | 03/08/2026 02:35 PM | Monica Ebunoluwa | 03/08/2026 02:35 PM | 2017 | 53,287 | 254,303 | 300,333 |
| 10 | Monica Ebunoluwa | 03/08/2026 02:35 PM | Monica Ebunoluwa | 03/08/2026 02:35 PM | 2016 | 36,054 | 226,993 | 267,812 |
NOTE: *Solar includes Solar thermal and photovoltaic (PV) energy
How Wind Got Here
Wind’s climb from 5,593 gigawatt-hours in 2000 to 464,391 in 2025 represents an 8,204% increase over a quarter century, according to EIA data.
The growth was not sudden.
Wind crossed a historically significant threshold in 2019, surpassing hydroelectric power as the largest renewable source for the first time, producing 295,882 GWh to hydro’s 287,874 GWh.
It has extended that lead every year since.
The record shows only one year-over-year decline across wind’s entire 25-year history.
Output fell from 434,297 GWh in 2022 to 421,141 GWh in 2023, the sole interruption in an otherwise unbroken upward trajectory.
Solar’s extraordinary curve
From 2000 to 2007, solar barely moved. It was a period during which the technology existed on the US grid in name only.
Then costs began falling, utility-scale deployment accelerated, and solar crossed an economic threshold that changed everything.
From 2012 to 2014, solar output roughly doubled over three years: 4,327 GWh, then 9,036 GWh, then 17,691 GWh.
The compounding effect has not stopped since.
In 2025 alone, solar added 75,837 GWh above its 2024 figure, more than three times the entire annual solar output of 2015.
The amount of solar generation added in a single recent year now exceeds what the whole solar industry produced annually a decade ago.
Hydro’s Plateau
Hydroelectric power has not grown in 25 years.
It produced 275,573 GWh in 2000 and 247,023 GWh in 2025, a 10.4% decline over the period, according to EIA data.
Unlike solar and wind, hydro cannot be meaningfully expanded through investment alone.
Its output is determined largely by rainfall, snowpack, and river flow.
Hydro oscillates with the weather rather than with policy or technology deployment.
In 2000, hydro accounted for 97.7% of the combined output of all three sources in the EIA dataset. By 2025, its share had fallen to 24.5%.
ELI5
In the year 2000, almost all of America’s renewable electricity came from dams. Wind and solar barely existed as energy sources.
By 2025, wind is producing the most renewable electricity of any source, solar has grown nearly 60,000% and now generates more power than all the dams combined, and hydro has actually declined slightly.
The US renewable energy mix looks completely different from what it did 25 years ago.
Source: