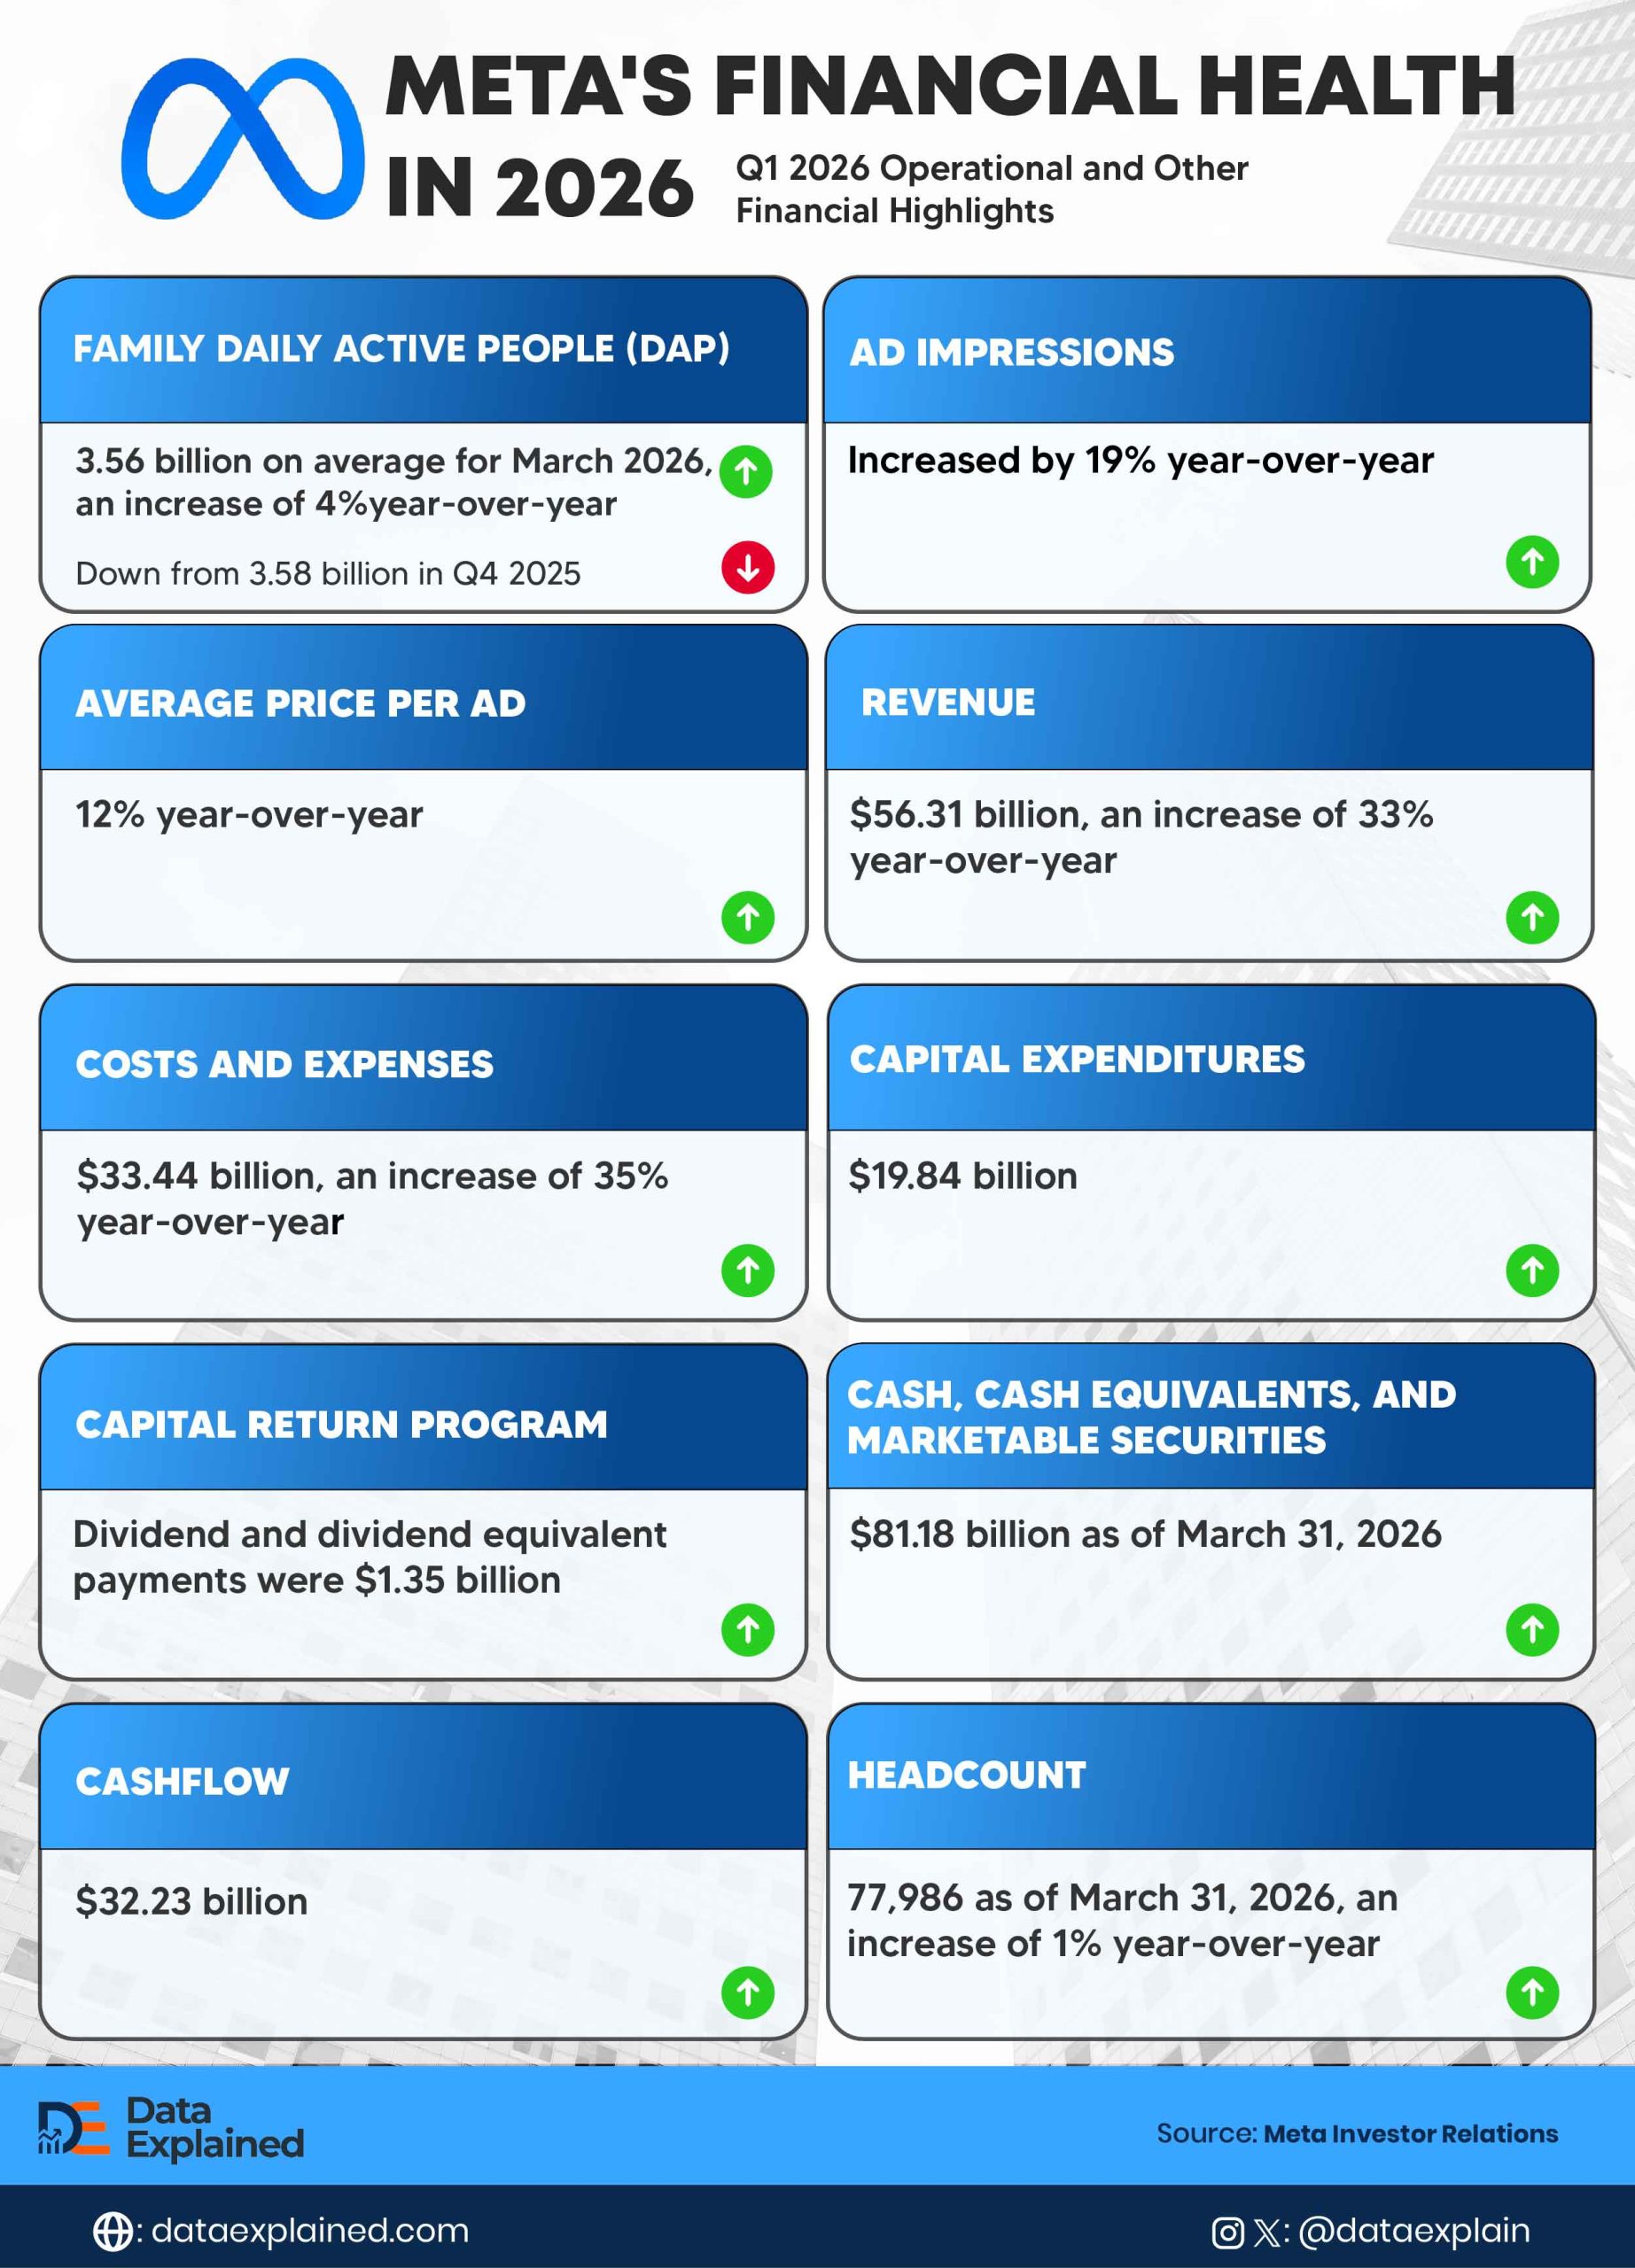
Meta generated $56.31 billion in revenue in the first quarter of 2026. It was a 33% year-over-year increase, while losing approximately 20 million daily active users over the same period.
And the fact that they moved in opposite directions in the same quarter is the most analytically significant feature of Meta’s April 29 earnings release.
Today’s infographic focuses on the company’s First Quarter 2026 Operational and Other Financial Highlights.
TL;DR
- Meta reported $56.31 billion in Q1 2026 revenue, up 33% year-over-year, while daily active users fell from 3.58 billion to 3.56 billion due to internet disruptions in Iran and Russia’s WhatsApp ban.
- Costs grew 35%, faster than revenue, and Meta spent $19.84 billion on infrastructure in a single quarter
- Despite losing users, Meta is making more money per user than ever, with ad impressions up 19% and ad prices up 12% simultaneously
| wdt_ID | wdt_created_by | wdt_created_at | wdt_last_edited_by | wdt_last_edited_at | Metric | Performance |
|---|---|---|---|---|---|---|
| 1 | emmanuel-ashemiriogwa | 15/05/2026 07:05 AM | emmanuel-ashemiriogwa | 15/05/2026 07:05 AM | Family daily active people (DAP) | 3.56 billion on average for March 2026, an increase of 4% year-over-yea |
| 2 | emmanuel-ashemiriogwa | 15/05/2026 07:05 AM | emmanuel-ashemiriogwa | 15/05/2026 07:05 AM | Ad impressions | increased by 19% year-over-year. |
| 3 | emmanuel-ashemiriogwa | 15/05/2026 07:05 AM | emmanuel-ashemiriogwa | 15/05/2026 07:05 AM | Average price per ad | 12% year-over-year. |
| 4 | emmanuel-ashemiriogwa | 15/05/2026 07:05 AM | emmanuel-ashemiriogwa | 15/05/2026 07:05 AM | Revenue | $56.31 billion, an increase of 33% year-over-year |
| 5 | emmanuel-ashemiriogwa | 15/05/2026 07:05 AM | emmanuel-ashemiriogwa | 15/05/2026 07:05 AM | Costs and expenses | $33.44 billion, an increase of 35% year-over-year |
| 6 | emmanuel-ashemiriogwa | 15/05/2026 07:05 AM | emmanuel-ashemiriogwa | 15/05/2026 07:05 AM | Capital expenditures | $19.84 billion. |
| 7 | emmanuel-ashemiriogwa | 15/05/2026 07:05 AM | emmanuel-ashemiriogwa | 15/05/2026 07:05 AM | Capital return program | Dividend and dividend equivalent payments were $1.35 billion |
| 8 | emmanuel-ashemiriogwa | 15/05/2026 07:05 AM | emmanuel-ashemiriogwa | 15/05/2026 07:05 AM | Cash, cash equivalents, and marketable securitie | $81.18 billion as of March 31, 2026. |
| 9 | emmanuel-ashemiriogwa | 15/05/2026 07:05 AM | emmanuel-ashemiriogwa | 15/05/2026 07:05 AM | Cashflow | $32.23 billion |
| 10 | emmanuel-ashemiriogwa | 15/05/2026 07:05 AM | emmanuel-ashemiriogwa | 15/05/2026 07:05 AM | Headcount | 77,986 as of March 31, 2026, an increase of 1% year-over-year. |
According to the company’s Q1 2026 operational highlights, Family Daily Active People (the metric tracking daily users across Facebook, Instagram, WhatsApp, and Messenger combined) averaged 3.56 billion in March 2026, down from 3.58 billion in Q4 2025.
Meta attributed the quarter-over-quarter decline explicitly to two geopolitical events:
- Internet disruptions in Iran linked to the ongoing conflict
- Government-imposed restrictions on WhatsApp access in Russia.
These were users removed by sovereign government decisions that Meta cannot reverse through product updates, pricing changes, or marketing campaigns.
Revenue Growing Without Users
For most of Meta’s history, user growth and revenue growth have moved together.
More daily users meant more advertising inventory, which meant more revenue.
The 33% revenue growth occurred despite a quarterly decline in users, driven by simultaneous growth in two advertising metrics.
Ad impressions delivered across Meta’s Family of Apps increased 19% year-over-year.
Average price per ad increased 12% year-over-year.
Both volume and price rising at the same time in the same marketplace is unusual; higher prices typically suppress demand for ad inventory.
Meta is generating enough advertiser demand to push both metrics upward concurrently, suggesting its AI-driven ad-targeting improvements are delivering a measurable return on investment that keeps advertisers spending more at higher prices.
Meta is extracting more value from each user even as the quarterly user count dips.
The Infrastructure Bill
Capital expenditure was $19.84 billion in Q1 2026 alone.
Annualized, that rate implies approximately $79 billion in infrastructure spending per year. This money is going into:
- AI data centers
- Server capacity
- Networking infrastructure
- Physical compute required to run recommendation algorithms and generative AI products
Costs and expenses for the quarter reached $33.44 billion, a 35% year-over-year increase, 2 percentage points faster than revenue growth.
Costs outpacing revenue is a margin compression signal that would concern analysts in isolation.
In Meta’s context, this reflects a deliberate investment rather than operational inefficiency. But the gap between cost growth and revenue growth is a number to watch in subsequent quarters.
On WhatsApp Russia Restriction…
The WhatsApp Russia restriction and the internet disruptions in Iran represent a specific category of risk that Meta cannot manage internally.
Russia has approximately 145 million people. Iran has approximately 88 million.
The users lost in Q1 2026 are not recoverable until political conditions in both countries change, which is entirely outside Meta’s control.
Meta has disclosed these events explicitly in its earnings release.
If the Iran conflict intensifies or the Russia restriction expands to other Meta platforms, the user impact in subsequent quarters could deepen before Q2 data arrives.
ELI5
Meta, the company behind Facebook, Instagram, and WhatsApp, made $56.3 billion in just three months, which is a record, but it also lost about 20 million daily users because Iran’s internet was cut off during the war, and Russia blocked WhatsApp. Even with fewer users, Meta is making more money from ads than ever. It also spent nearly $20 billion in a single quarter on building AI computer systems.
Source: