
The current U.S.-Israel war with Iran marks the sixth out of major global oil supply disruptions since 1973, with production cuts reaching approximately 6.7 million barrels per day (bpd).
That figure is 40% worse than the 4.8 million barrels per day loss during Iran’s 1978-1979 revolution, which took months to stabilize.
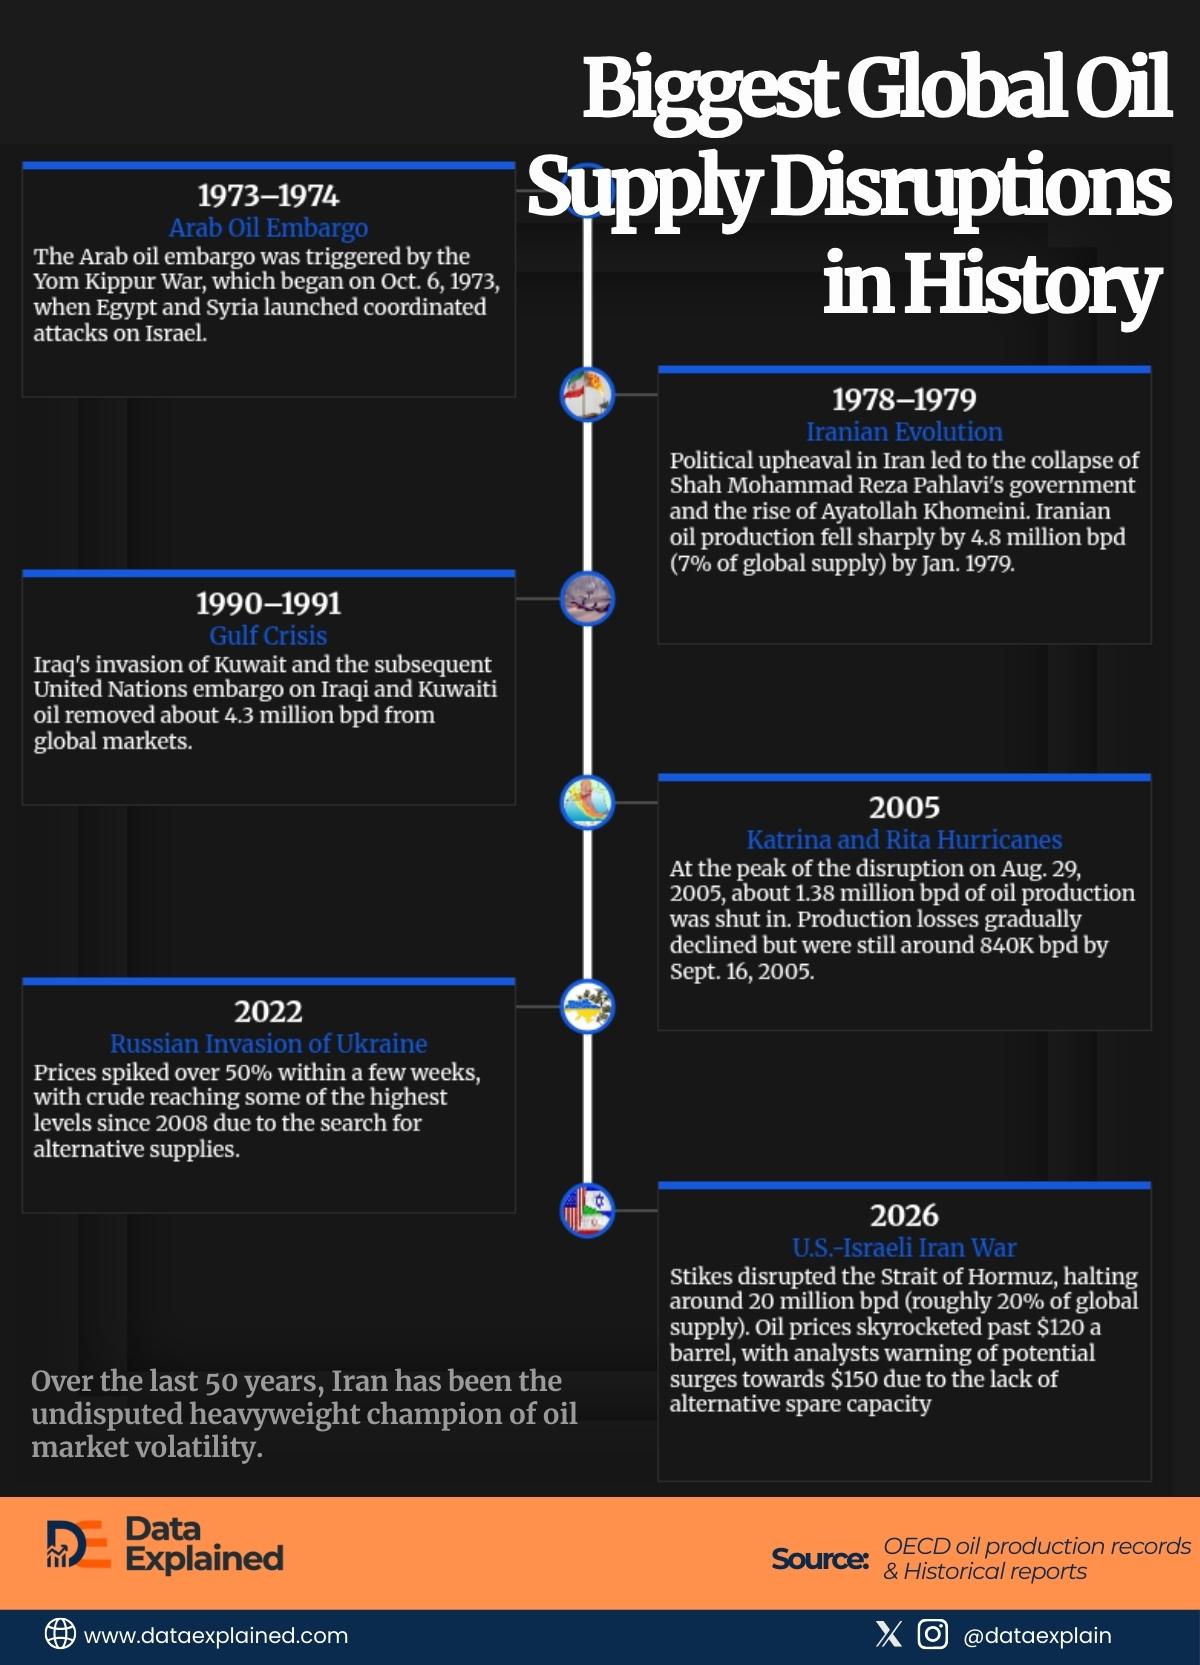
Today’s visualization shows the trend of the biggest global oil supply disruptions in history. For this data, we used historical reports and OECD oil production records.
It shows that five of the six major disruptions over 50 years originated in the Middle East.
TL;DR
- Current Iran war is the third time in 50 years that Iran has been at the center of a global historic oil supply collapse.
- Five of the six major oil disruptions (83%) over the last 53 years have been geopolitical events rooted in the Middle East.
| wdt_ID | wdt_created_by | wdt_created_at | wdt_last_edited_by | wdt_last_edited_at | Year | Oil Disruption |
|---|---|---|---|---|---|---|
| 1 | emmanuel-ashemiriogwa | 19/03/2026 11:47 AM | emmanuel-ashemiriogwa | 19/03/2026 11:47 AM | 1973–1974 | Arab Oil Embargo |
| 2 | emmanuel-ashemiriogwa | 19/03/2026 11:47 AM | emmanuel-ashemiriogwa | 19/03/2026 11:47 AM | 1978–1979 | Iranian Evolution |
| 3 | emmanuel-ashemiriogwa | 19/03/2026 11:47 AM | emmanuel-ashemiriogwa | 19/03/2026 11:47 AM | 1990–1991 | Gulf Crisis |
| 4 | emmanuel-ashemiriogwa | 19/03/2026 11:47 AM | emmanuel-ashemiriogwa | 19/03/2026 11:47 AM | 2005 | Katrina and Rita Hurricanes |
| 5 | emmanuel-ashemiriogwa | 19/03/2026 11:47 AM | emmanuel-ashemiriogwa | 19/03/2026 12:11 PM | 2022 | Russian Invasion of Ukraine |
| 6 | emmanuel-ashemiriogwa | 19/03/2026 11:47 AM | emmanuel-ashemiriogwa | 19/03/2026 11:47 AM | 2026 | U.S.-Israeli Iran War |
There’s an apparent pattern of Iran’s central role in oil market instability.
It appeared in three of the six crises (the 1979 revolution, possibly the 2022 Strait of Hormuz strikes during the Ukraine war period, and now the 2026 conflict).
Also, geopolitical events have overwhelmingly dominated supply shocks, with only one weather-related disruption (Hurricane Katrina’s 1.38 million barrel peak in 2005) among the major crises.
Iran Connection
Over the last 50 years, Iran has been the undisputed heavyweight champion of oil market volatility. This is the third time the country has been at the center of a global historic supply collapse:
- 1978-1979: The Revolution (4.8 million bpd loss)
- 2022: The Hormuz Strikes (A massive 20 million bpd anomaly during the Ukraine war)
- 2026: The Current War (~6.7 million bpd cut)
The 47-year gap between the ’79 Revolution and today’s war might seem like a long time, but for the oil markets, it’s a blink.
The Middle East Dominance
Five of the six major disruptions (83%) over the last 53 years have been geopolitical events rooted in this single region.
The only outlier is 2005’s Hurricane Katrina. While Katrina was devastating, the data show that natural disasters are relatively “quick fixes” for the oil market.
Frequency is Accelerating
One of the most alarming insights from the data is the speed at which these crises are occurring.
- 1973 to 2005: Three major disruptions in 32 years.
- 2005 to 2026: Three major disruptions in just 21 years.
The interval between shocks is shrinking. We went from a 17-year gap (2005 to 2022) to a mere four-year gap (2022 to 2026). The global energy grid is becoming more fragile even as our reliance on a stable supply remains absolute.
So, What?
Historical precedent from 1979 (when Iran’s revolutionary upheaval and the rise of Ayatollah Khomeini removed 4.8 million bpd from global markets) suggests the current war could cause prolonged disruptions lasting months rather than weeks.
Oil prices already hit around $120 per barrel in 2026, matching the 2022 spike.
Analysts warn of potential surges toward $150 due to the lack of alternative spare capacity in a system that has experienced accelerating disruption frequency over recent decades.
Source:
OECD oil production records | Reuters