
The United States recorded a goods trade deficit of $1.24 trillion in 2025, the highest on record, according to the Census Bureau and the Bureau of Economic Analysis.
A trade deficit means America is buying more goods from the rest of the world than it is selling back. At $1.24 trillion, up 2.1% from 2024, the gap has never been wider.
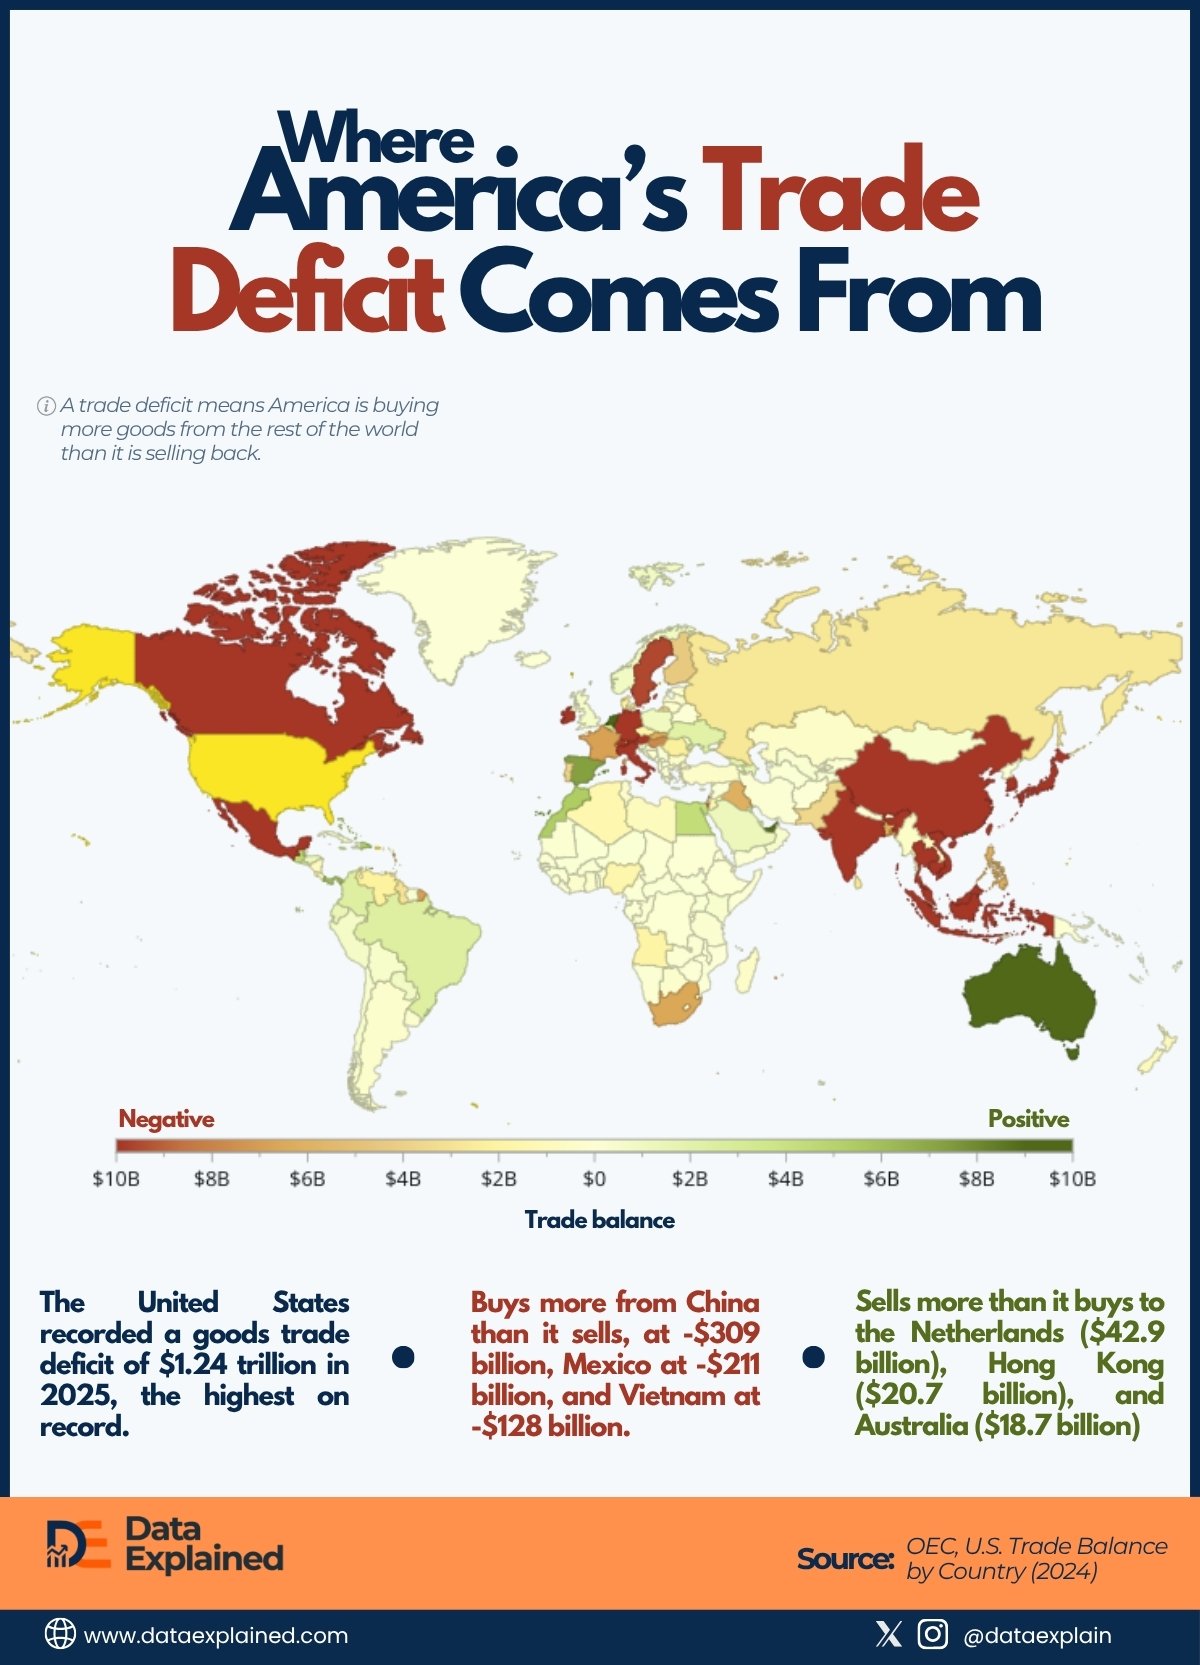
Today’s map infographic shows U.S. Trade Balance by Country, based on data from the Observatory of Economic Complexity (OEC) as of 2024.
As you can see in the visualization, red indicates a country sells more to America than it buys from America. Canada, China, Vietnam, Germany, Japan, South Korea, and India are all red. Most of Europe and Asia are also red.
The United States is running trade deficits with virtually every major region of the world simultaneously.
TL;DR
- America buys more from China than it sells, at -$309 billion, Mexico at -$211 billion, and Vietnam at -$128 billion.
- The U.S. sells more to the Netherlands ($42.9 billion), Hong Kong ($20.7 billion), and Australia ($18.7 billion) than it buys from them.
Ranked: Negative U.S. Trade Balance by Country
| wdt_ID | wdt_created_by | wdt_created_at | wdt_last_edited_by | wdt_last_edited_at | Country | Exports ($bn) | Imports ($bn) | Trade Balance ($bn) |
|---|---|---|---|---|---|---|---|---|
| 1 | emmanuel-ashemiriogwa | 14/04/2026 12:54 PM | emmanuel-ashemiriogwa | 14/04/2026 12:54 PM | China | 144.70 | 453.30 | -308.60 |
| 2 | emmanuel-ashemiriogwa | 14/04/2026 12:54 PM | emmanuel-ashemiriogwa | 14/04/2026 12:54 PM | Mexico | 282.83 | 493.58 | -210.75 |
| 3 | emmanuel-ashemiriogwa | 14/04/2026 12:54 PM | emmanuel-ashemiriogwa | 14/04/2026 12:54 PM | Vietnam | 12.57 | 140.49 | -127.92 |
| 4 | emmanuel-ashemiriogwa | 14/04/2026 12:54 PM | emmanuel-ashemiriogwa | 14/04/2026 12:54 PM | Canada | 272.67 | 400.41 | -127.73 |
| 5 | emmanuel-ashemiriogwa | 14/04/2026 12:54 PM | emmanuel-ashemiriogwa | 14/04/2026 12:54 PM | Germany | 82.00 | 160.89 | -78.90 |
| 6 | emmanuel-ashemiriogwa | 14/04/2026 12:54 PM | emmanuel-ashemiriogwa | 14/04/2026 12:54 PM | Japan | 79.45 | 141.03 | -61.58 |
| 7 | emmanuel-ashemiriogwa | 14/04/2026 12:54 PM | emmanuel-ashemiriogwa | 14/04/2026 12:54 PM | South Korea | 70.22 | 131.11 | -60.89 |
| 8 | emmanuel-ashemiriogwa | 14/04/2026 12:54 PM | emmanuel-ashemiriogwa | 14/04/2026 12:54 PM | Ireland | 19.48 | 77.91 | -58.43 |
| 9 | emmanuel-ashemiriogwa | 14/04/2026 12:54 PM | emmanuel-ashemiriogwa | 14/04/2026 12:54 PM | Chinese Taipei | 38.35 | 93.83 | -55.48 |
| 10 | emmanuel-ashemiriogwa | 14/04/2026 12:54 PM | emmanuel-ashemiriogwa | 14/04/2026 12:54 PM | India | 39.12 | 85.33 | -46.22 |
Five Countries, Two-Thirds of the Deficit
Five countries account for approximately $854.9 billion (roughly 69%) of the announced U.S. trade deficit, according to OEC data.
China leads by an enormous margin at $309 billion. That is the largest bilateral trade imbalance between any two countries in recorded global trade history.
Despite years of tariffs introduced during Trump’s first term, a full trade war, COVID-era supply chain disruption, and active political pressure to decouple the two economies, the China-U.S. trade gap has remained the defining number in global commerce.
Mexico follows at $211 billion, the second-largest deficit country in the world after America.
Vietnam and Canada are tied at $128 billion each. Germany rounds out the top five at $78.9 billion.
The figures for Mexico and Canada carry a specific irony.
Both countries are parties to the United States-Mexico-Canada Agreement (USMCA), which Trump renegotiated and signed during his first term as a signature trade achievement.
Both remain among the top deficit countries in the world with America.
The trade deal designed to rebalance North American commerce is operating alongside the largest North American trade deficits ever recorded.
The Vietnam Warning
Vietnam was not in this position ten years ago.
It got there because of the first round of Trump tariffs on Chinese goods in 2018 and 2019.
As those tariffs made Chinese manufacturing more expensive for American importers, factories shifted production to Vietnam, Bangladesh, and other lower-cost alternatives.
The deficit with China modestly narrowed.
The Green Exceptions
A handful of countries appear green on the map, meaning the U.S. sells more to them than it buys.
The five largest positive balances in 2024 were the Netherlands at $42.9 billion, Hong Kong at $20.7 billion, Australia at $18.7 billion, the United Arab Emirates at $15.7 billion, and Singapore at $12.7 billion.
Four of those five are major logistics and re-export hubs rather than straightforward bilateral trading partners.
The Port of Rotterdam is Europe’s largest entry point for goods.
Meanwhile, American exports recorded as going to the Netherlands are largely exports to the broader European continent, clearing Dutch customs.
Dubai and Singapore perform similar transshipment functions for their respective regions.
The U.S. trade surplus with these countries is partly a geography-of-logistics story rather than a pure measure of American export competitiveness.
Bringing Tariffs to the Conversation
On April 2, 2025, the Trump administration announced what it called “Liberation Day” tariffs (145% on Chinese goods, 25% on Canada and Mexico, and broad baseline rates targeting dozens of additional trading partners).
The OEC 2024 data is effectively the target list of that policy.
The five largest deficit countries are all directly in the crosshairs.
So are American security allies: Japan and South Korea both host tens of thousands of U.S. troops and both run trade surpluses with Washington.
Germany, a NATO partner, posts a $78.9 billion surplus driven significantly by automobile exports.
ELI5
America is surrounded by red, and the deficit has reached a record that no previous administration’s trade policy has managed to reverse.
What the map cannot show is whether tariffs applied to a $1.24 trillion structural deficit will move the color, or whether the underlying conditions that produced it are more durable than the policy being deployed against them.
The 2026 data, when it arrives, will provide the answer.
Sources:
OEC, U.S. Trade Balance by Country (2024) | U.S. Census Bureau and Bureau of Economic Analysis