
UK inflation fell to 3% in the year to January 2026, down from December’s 3.4%, as food and fuel costs eased, the Office for National Statistics announced last week.
The drop, driven by lower prices for bread, cereal, and petrol, was forecast by economists and continues the dramatic descent from the cost-of-living crisis that peaked in 2022.
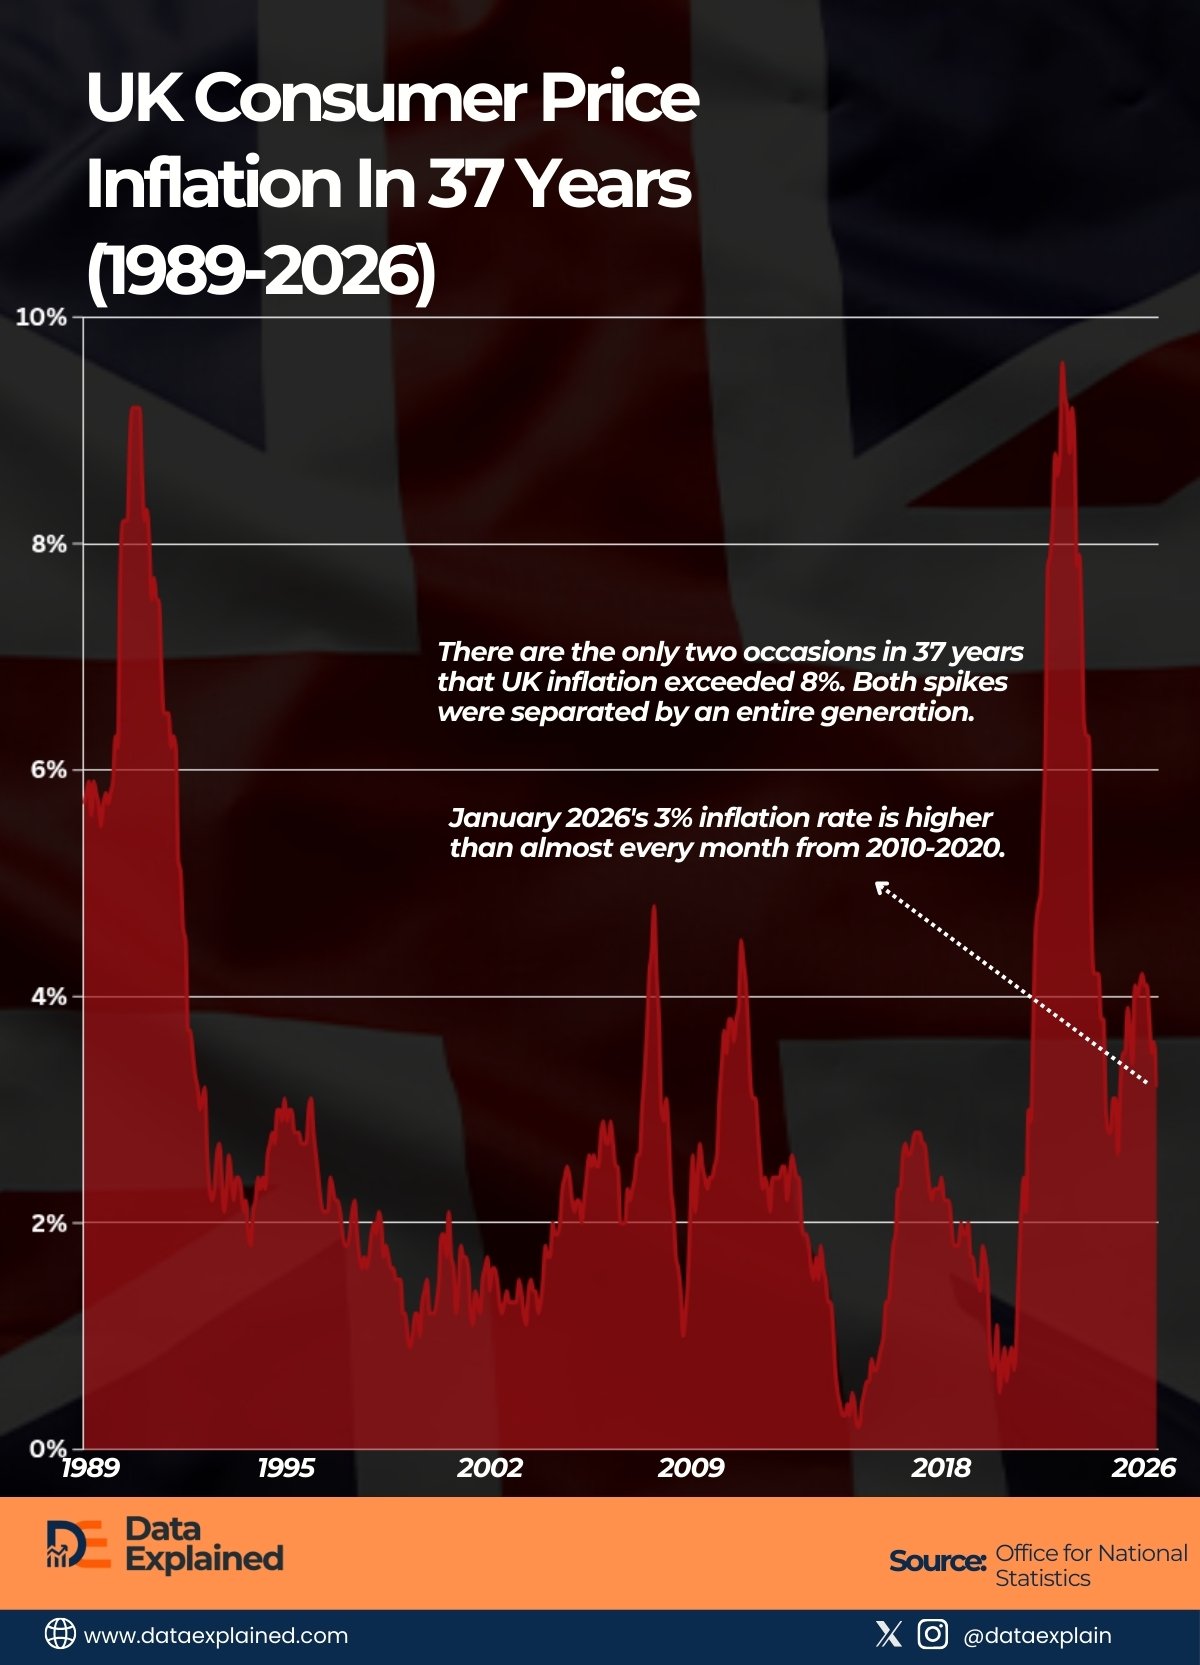
But the 37-year chart of UK consumer price inflation above reveals an uncomfortable truth.
Today’s 3% figure, widely celebrated as progress, is actually higher than almost every single month from 2010 to 2020.
What now counts as good news would have been cause for concern just a decade ago.
TL;DR
- January’s 3% inflation rate is higher than almost every month from 2010-2020.
- The recent inflation spike matched the 1990-91 crisis peak almost exactly at ~9%, making it the only two times in 37 years that UK inflation exceeded 8%.
| wdt_ID | wdt_created_by | wdt_created_at | wdt_last_edited_by | wdt_last_edited_at | Year | Inflation Rate |
|---|---|---|---|---|---|---|
| 1 | emmanuel-ashemiriogwa | 22/02/2026 11:31 PM | emmanuel-ashemiriogwa | 22/02/2026 11:31 PM | 01/01/1989 | 5.70 |
| 2 | emmanuel-ashemiriogwa | 22/02/2026 11:31 PM | emmanuel-ashemiriogwa | 22/02/2026 11:31 PM | 01/02/1989 | 5.80 |
| 3 | emmanuel-ashemiriogwa | 22/02/2026 11:31 PM | emmanuel-ashemiriogwa | 22/02/2026 11:31 PM | 01/03/1989 | 5.90 |
| 4 | emmanuel-ashemiriogwa | 22/02/2026 11:31 PM | emmanuel-ashemiriogwa | 22/02/2026 11:31 PM | 01/04/1989 | 5.60 |
| 5 | emmanuel-ashemiriogwa | 22/02/2026 11:31 PM | emmanuel-ashemiriogwa | 22/02/2026 11:31 PM | 01/05/1989 | 5.90 |
| 6 | emmanuel-ashemiriogwa | 22/02/2026 11:31 PM | emmanuel-ashemiriogwa | 22/02/2026 11:31 PM | 01/06/1989 | 5.80 |
| 7 | emmanuel-ashemiriogwa | 22/02/2026 11:31 PM | emmanuel-ashemiriogwa | 22/02/2026 11:31 PM | 01/07/1989 | 5.70 |
| 8 | emmanuel-ashemiriogwa | 22/02/2026 11:31 PM | emmanuel-ashemiriogwa | 22/02/2026 11:31 PM | 01/08/1989 | 5.50 |
| 9 | emmanuel-ashemiriogwa | 22/02/2026 11:31 PM | emmanuel-ashemiriogwa | 22/02/2026 11:31 PM | 01/09/1989 | 5.70 |
| 10 | emmanuel-ashemiriogwa | 22/02/2026 11:31 PM | emmanuel-ashemiriogwa | 22/02/2026 11:31 PM | 01/10/1989 | 5.80 |
Throughout the entire 2010-2020 period, UK inflation rarely exceeded 2.5%.
For most of those years, it hovered between 1.5% and 2%, occasionally dipping below the Bank of England’s 2% target and raising fears of deflation.
The current 3% rate, while down sharply from recent peaks, remains 50% above the central bank’s target and higher than the majority of the past decade.
Two mirror-image crises, 32 years apart
The long-term data also reveal that the recent inflation spike reached almost exactly the same height as the early 1990s recession.
The 2022-23 peak hit approximately 9.5%, matching the 1990-91 crisis when inflation topped 9%.
These are the only two occasions in 37 years that UK inflation exceeded 8%. Both spikes were separated by an entire generation.
Both crises also shared a common trigger: energy shocks caused by geopolitical turmoil.
The 1990-91 spike coincided with the Gulf War and oil price surges. The 2022-23 crisis was fueled by Russia’s invasion of Ukraine and the resulting European energy catastrophe.
The fastest decline in 33 years
From the 9.5% peak to today’s 3% represents a 6.5 percentage-point decline in roughly 24 months. This is the steepest decline in inflation since the 1991-93 period, when the previous spike unwound.
The speed of the collapse has surprised many analysts who expected inflation to prove more persistent.
Yet the descent appears to be stalling.
Inflation has hovered around 3% for five consecutive months, suggesting this level may represent a new floor rather than a temporary pause on the way to the 2% target.
Back where we started
Perhaps the most remarkable feature of the 37-year chart is that current inflation is almost exactly the same as late 2021, just before the post-COVID crisis began.
After three years of economic upheaval, rising interest rates, squeezed household budgets, and political turmoil, the UK has essentially returned to its starting point.
The entire 2022-23 inflation spike has been unwound, leaving prices at the same growth rate as before the crisis started.
But the economy hasn’t returned to normal.
Interest rates remain elevated, household savings have been depleted, and the cost of living is permanently higher, even though the rate of increase has slowed.
What ‘still above target’ really means
While 3% sounds close to the Bank of England’s 2% target, the difference is more significant than it appears.
In relative terms, 3% is 50% higher than 2%—the equivalent of the gap between 2% and 3% would mean inflation rising to 4.5% if it increased by the same proportion again.
The Bank hasn’t declared victory.
At every meeting, policymakers wrestle with when they can safely cut interest rates without reigniting inflation.
Notably, the 2008 financial crisis (the worst economic collapse since the Great Depression) barely registers on this inflation chart.
That crisis caused inflation to plunge toward zero, raising deflation fears.
The 2022-23 crisis, by contrast, sent inflation to 9.5%. They were fundamentally different events. That is, a demand shock versus a supply shock.
The question now is what drives inflation from 3% down to 2%?
If falling bread, cereal, and petrol prices only brought it to 3%, reaching the target may require something more dramatic. Services inflation, driven by wages, remains sticky.
Sources:
Office for National Statistics | BBC | Parliament.UK