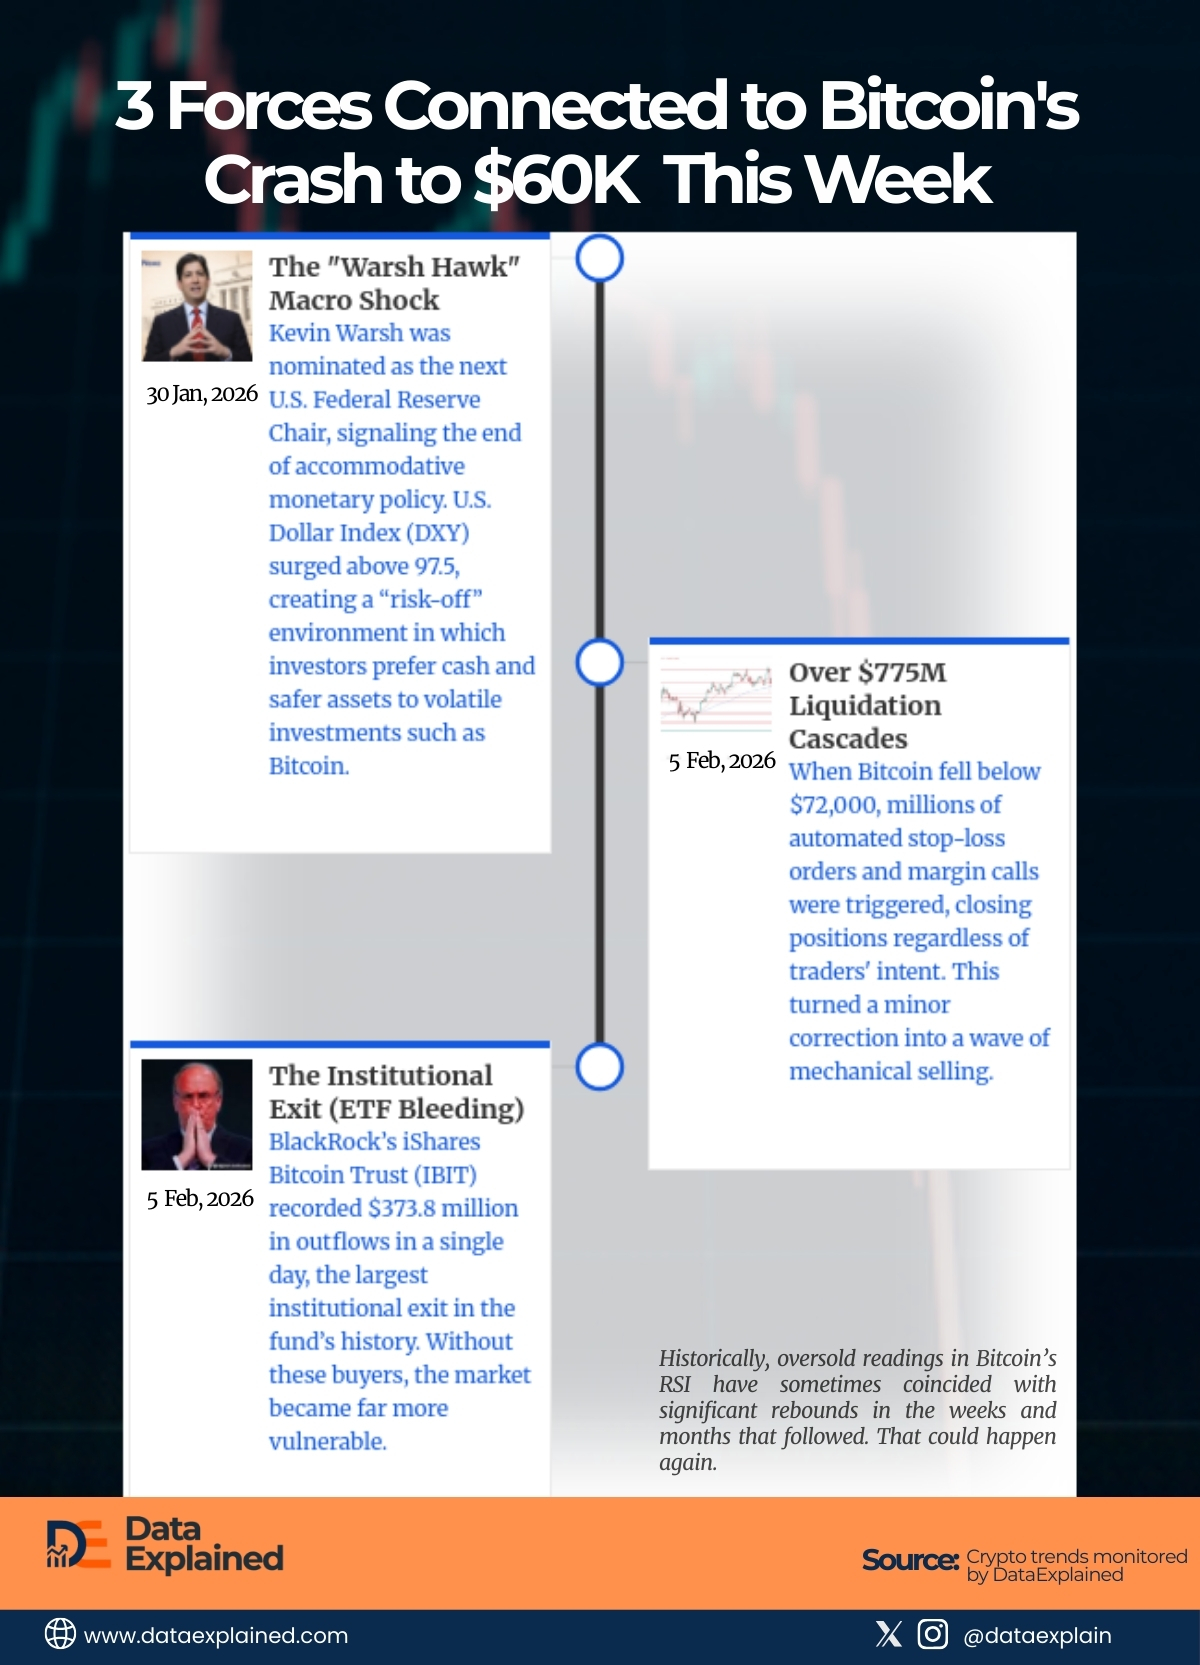
Bitcoin plunged below $60,000 this week for the first time since October 2024, capping a brutal four-month slide that erased half the cryptocurrency’s value from its $126,000 peak.
The collapse, which triggered more than $2.5 billion in forced liquidations, wasn’t caused by a single shock but rather three converging forces:
- A massive unwinding of leveraged bets
- The January 30 nomination of hawkish Fed chair candidate Kevin Warsh that sent the dollar soaring
- Relentless institutional selling through Bitcoin ETFs that bled $1.7 billion in a single week.
The visualization above presents a timeline illustrating how these pressures have recently transformed the crypto space.
TL;DR
- Cryptocurrency markets plunged for the third consecutive session on February 5, 2026, with Bitcoin testing $60,000.
- Historically, oversold readings in Bitcoin’s RSI have sometimes coincided with significant rebounds in the weeks and months that followed. That could happen again.
Force 1: The $775M Liquidation Cascades
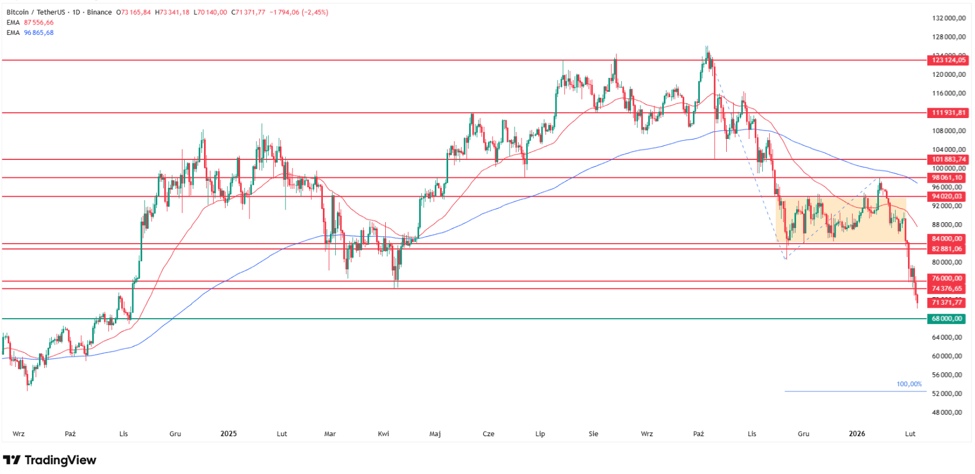
A major driver of Bitcoin’s drop to $60,000 this week was a cascade of forced liquidations in leveraged markets, where traders borrow money to amplify bets.
When Bitcoin fell below $72,000, millions of automated stop-loss orders and margin calls were triggered, closing positions regardless of traders’ intent.
This turned a minor correction into a wave of mechanical selling.
According to Coinglass data, approximately $775 million in leveraged positions were liquidated during the period covered by this report, wiping out over 570,000 traders in the largest single-day event since the 2024 Bitcoin halving.
Liquidation cascades happen because exchanges automatically sell positions when losses exceed available margin.
As these forced sales pushed prices lower, they triggered additional liquidations, creating a self-reinforcing downward spiral.
The speed and scale of this process overwhelmed traditional market buyers, breaching multiple support levels within hours rather than days.
Force 2: The “Warsh Hawk” Macro Shock
Bitcoin’s crash was also influenced by broader U.S. monetary policy.
On January 30, Kevin Warsh was nominated as the next U.S. Federal Reserve Chair, signaling the end of accommodative monetary policy.
Known as a monetary hawk, Warsh prioritizes controlling inflation over supporting markets, and his nomination immediately changed investor expectations about interest rates and liquidity.
The reaction was swift.
The U.S. Dollar Index (DXY) surged above 97.5, creating a “risk-off” environment in which investors prefer cash and safer assets to volatile investments such as Bitcoin.
CMC’s crypto fear and greed index currently points to 5 in “extreme fear” (its lowest reading since the index launched in June 2023).
So it boils down to:
- Rising rates and tighter liquidity reduce appetite for speculative markets, leading to capital outflows from crypto.
- Additionally, Warsh’s plan to reduce the balance sheet further encouraged investors to exit risky assets.
- Even without panic selling, this macro backdrop meant there were fewer buyers in the market, just as leveraged liquidations were amplifying losses.
Force 3: The Institutional Exit (ETF Bleeding)
The third major factor behind Bitcoin’s fall was heavy institutional selling through spot Bitcoin ETFs.
These are funds that enable large investors to purchase Bitcoin without directly owning it.
These ETFs have historically served as a safety net, supporting price floors by providing consistent buying pressure.
In recent weeks, that support reversed sharply.
BlackRock’s iShares Bitcoin Trust (IBIT) recorded $373.8 million in outflows in a single day, the largest institutional exit in the fund’s history. This is according to Arkham Intelligence data.
Across all U.S. spot Bitcoin ETFs, total withdrawals since mid-January have exceeded $3 billion, removing a significant source of institutional demand that had previously helped keep Bitcoin above $70,000.
Without these buyers, the market became far more vulnerable.
ETF redemptions forced funds to sell Bitcoin into a market already under pressure from leveraged liquidations and macro shocks.
This removed one of the strongest sources of demand, accelerating the decline and amplifying volatility.
What To Expect?
After Bitcoin’s sharp descent to $60,000, one commonly used technical indicator is the Relative Strength Index (RSI), a measure of recent price momentum.
When RSI falls into “oversold” territory, it means selling pressure has been unusually intense.
Historically, oversold readings in Bitcoin’s RSI have sometimes coincided with significant rebounds in the weeks and months that followed.
For example, similar conditions appeared during deep market corrections in 2018 and 2022, each of which was followed by notable rallies once selling pressure eased.
Right now, technical indicators suggest that Bitcoin is at very low RSI levels, which some analysts view as a signal that selling momentum may be overstretched and could give way to stabilization or a rebound if demand returns.
However, it’s important to stress that oversold signals do not, on their own, guarantee a recovery, especially in markets currently influenced by broader macroeconomic pressures and capital flows.
In past cycles, extreme RSI readings sometimes preceded subsequent volatility, which eventually culminated in rallies.
ELI5
Bitcoin crashed to $60,000 this week because three big forces hit at once.
More than 570,000 traders incurred losses as leveraged trades were liquidated. The dollar surged above 97.5 after Kevin Warsh’s Fed nomination, making risky assets less attractive, and $3 billion flowed out of Bitcoin ETFs, including $373.8 million from BlackRock’s IBIT.
Technical indicators now show Bitcoin may be oversold, suggesting a potential bounce or stabilization ahead.
Sources
CoinGlass Liquidation Tracker | Coin Market Cap Greed and Fear Index | Finance magnates | Reuters | Coincentral |