
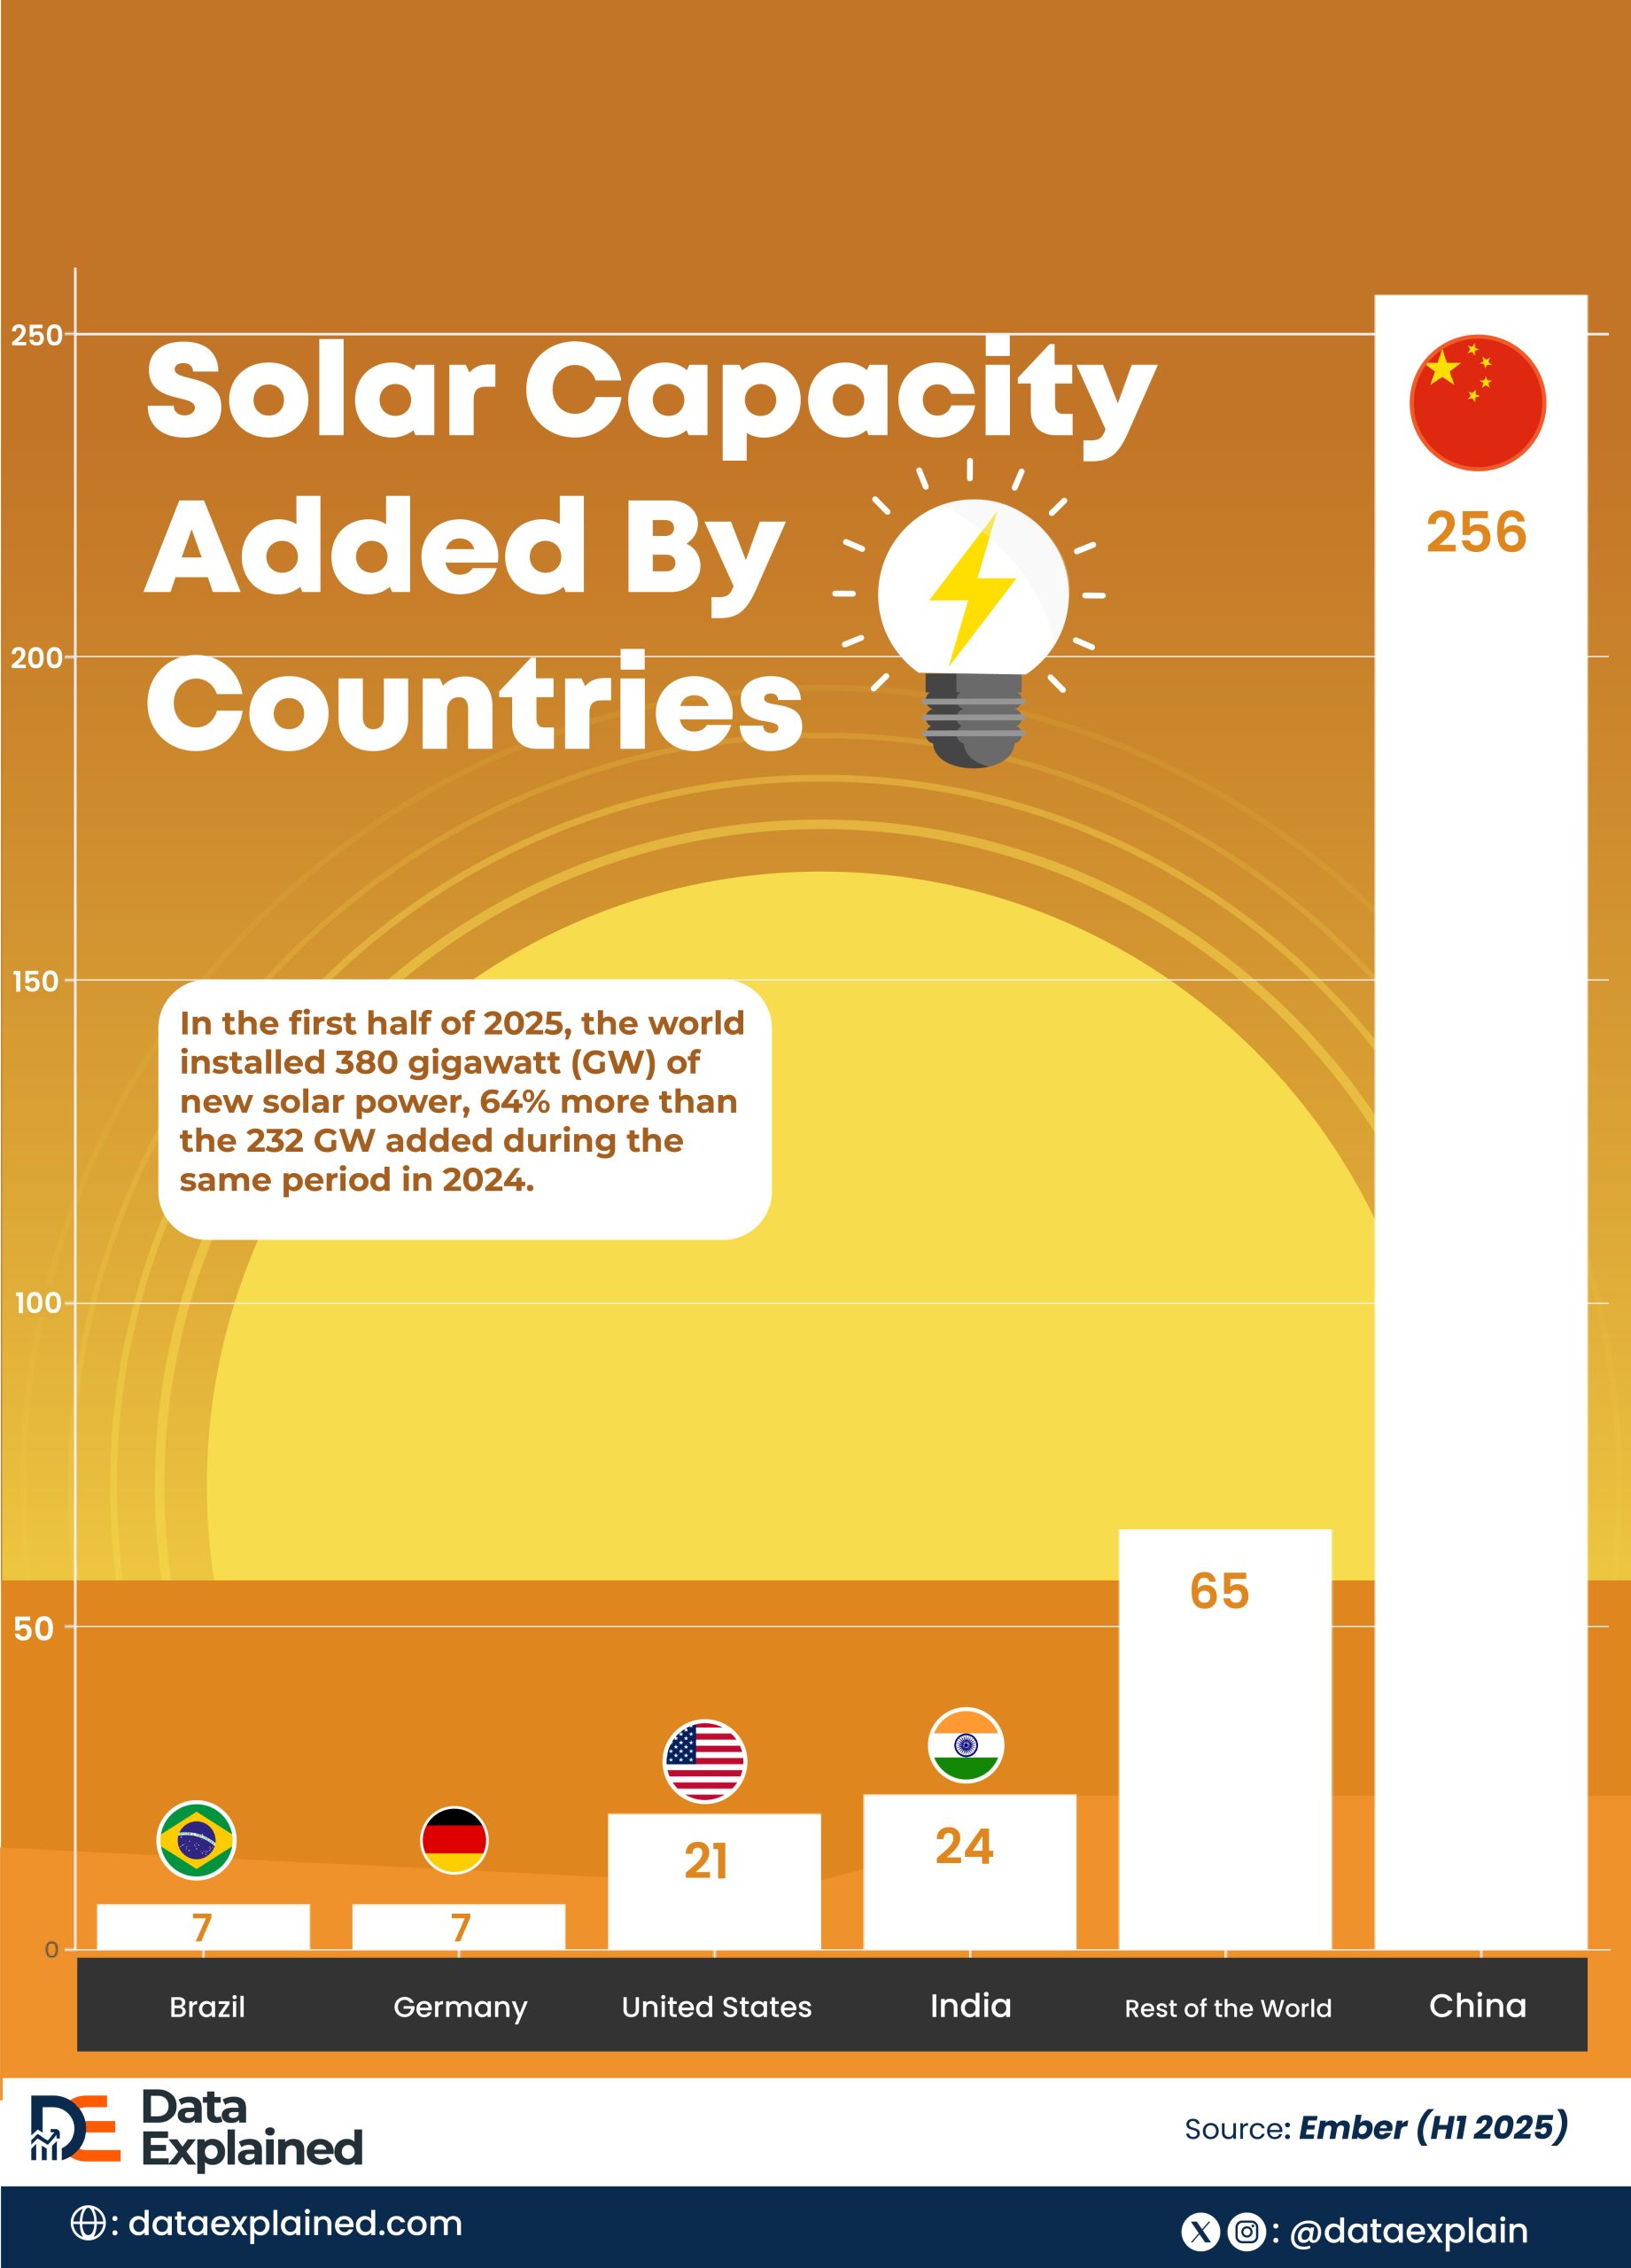
In the first half of 2025, the world installed 380 gigawatt (GW) of new solar power, 64% more than the 232 GW added during the same period in 2024.
For context, 380 GW can power approximately 100-130 million average homes continuously, which is like every household in California, Texas, Florida, and New York combined.
This rapid growth indicates that solar energy is entering a new era of expansion. But which countries added the most solar capacity in 2025?
TL;DR
- China led the growth, adding two-thirds (256 GW) of the total by rushing policies before subsidy cuts
- After a possible slowdown in 2026, solar energy is expected to continue growing rapidly, reaching 540 GW annually.
This visualization shows the solar capacity in GW added in the first half of 2025 by the top economies, including China, India, the United States, Germany, and Brazil.
The data comes from Ember, which tracks global solar installations.
Top Countries by Solar Capacity Added (H1 2025)
| wdt_ID | wdt_created_by | wdt_created_at | wdt_last_edited_by | wdt_last_edited_at | Country | Solar Capacity Added in H1 2025 (GW) |
|---|---|---|---|---|---|---|
| 1 | Monica Ebunoluwa | 23/01/2026 02:12 PM | Monica Ebunoluwa | 23/01/2026 02:12 PM | China | 256 |
| 2 | Monica Ebunoluwa | 23/01/2026 02:12 PM | Monica Ebunoluwa | 23/01/2026 02:12 PM | India | 24 |
| 3 | Monica Ebunoluwa | 23/01/2026 02:12 PM | Monica Ebunoluwa | 23/01/2026 02:12 PM | United States | 21 |
| 4 | Monica Ebunoluwa | 23/01/2026 02:12 PM | Monica Ebunoluwa | 23/01/2026 02:12 PM | Germany | 7 |
| 5 | Monica Ebunoluwa | 23/01/2026 02:12 PM | Monica Ebunoluwa | 23/01/2026 02:12 PM | Brazil | 7 |
| 6 | Monica Ebunoluwa | 23/01/2026 02:12 PM | Monica Ebunoluwa | 23/01/2026 02:12 PM | Rest of the World | 65 |
China added 256 GW of solar power in the first half of 2025, as developers rushed to finish projects before the market-based pricing began on June 1.
They secured guaranteed tariffs under the old rules, leading to the most significant solar build-out ever.
The policy change ended fixed subsidies for new projects, prompting developers to act quickly.
Most growth came from massive desert farms, such as the Talatan Solar Park in Qinghai, which spans an area seven times that of Manhattan and features over 7 million panels.
New mega-projects appeared quickly on the Tibetan Plateau and in Inner Mongolia.
Grid issues led to solar curtailment reaching 6.6% in the first half of 2025, nearly double the level in the previous year.
Meanwhile, manufacturing overcapacity lowered module prices and squeezed profits.
After June, growth slowed sharply, but by October, installations began to pick up as uncertainty lessened.
Generally, Asian Countries Lead in Solar Adoption
Asia led global solar growth in 2025, accounting for nearly 80% of new capacity in the first half of the year.
China contributed 67%, with India and other Asian countries accounting for the rest.
This made the world more dependent on Asian supply chains and policies.
Emerging markets outside China saw significant percentage gains. India grew by 49% year over year in H1, while Brazil, Pakistan, and Southeast Asian countries also saw significant improvements.
Most new solar capacity in 2025 came from utility-scale projects.
China favored large ground-mounted farms early in the year, while solar installations in the U.S., Europe, and Australia continued to grow, including rooftop and community systems.
On the other hand, the Americas and Europe had smaller volumes than Asia, while Africa and the Middle East lagged due to grid limits and financing issues.
Looking ahead…
Going from 232 GW to 380 GW in one year means solar installation is accelerating exponentially. If this continues:
- 2026: ~625 GW in 6 months
- 2027: ~1,025 GW in 6 months
This is like going from building 100 cars per day to suddenly building 164, then 269, then 441 (doubling every 18 months).
During the recent COP30 conference, China announced it will expand wind and solar power capacity sixfold from 2020 levels by 2035 and increase non-fossil fuels to over 30% of total energy consumption.
So, a lot is literally going on in this sector.
For context, Fossil fuels took 150 years to build. We’re now replacing them at a pace where solar alone could theoretically power most of civilization within 10-15 years at this growth rate.
ELI5: Countries that Added the Most Solar Capacity
Electricity generation from sunlight improved significantly in 2025, reaching 600 GW worldwide, including a record 380 GW in the first half of the year.
This type of electric power generation is popular in Asia, led by major Chinese projects on the Tibetan Plateau and in Inner Mongolia, which added 256 GW by implementing rapid policies before subsidy cuts.
After a possible slowdown in 2026, solar energy is expected to continue growing rapidly, reaching 540 GW annually.
Sources:
Reuters | NYTimes | Reuters | International Energy Agency | CleanTechnica | IEA | IEA | Wikipedia