The 2026 FIFA World Cup kicks off today, June 11.
With that in mind, the US accommodation market has not moved the way the industry projected.
The American Hotel and Lodging Association, surveying more than 200 hotels across the 11 US host cities, found 80% of respondents reporting that World Cup occupancy is tracking below their initial forecasts.
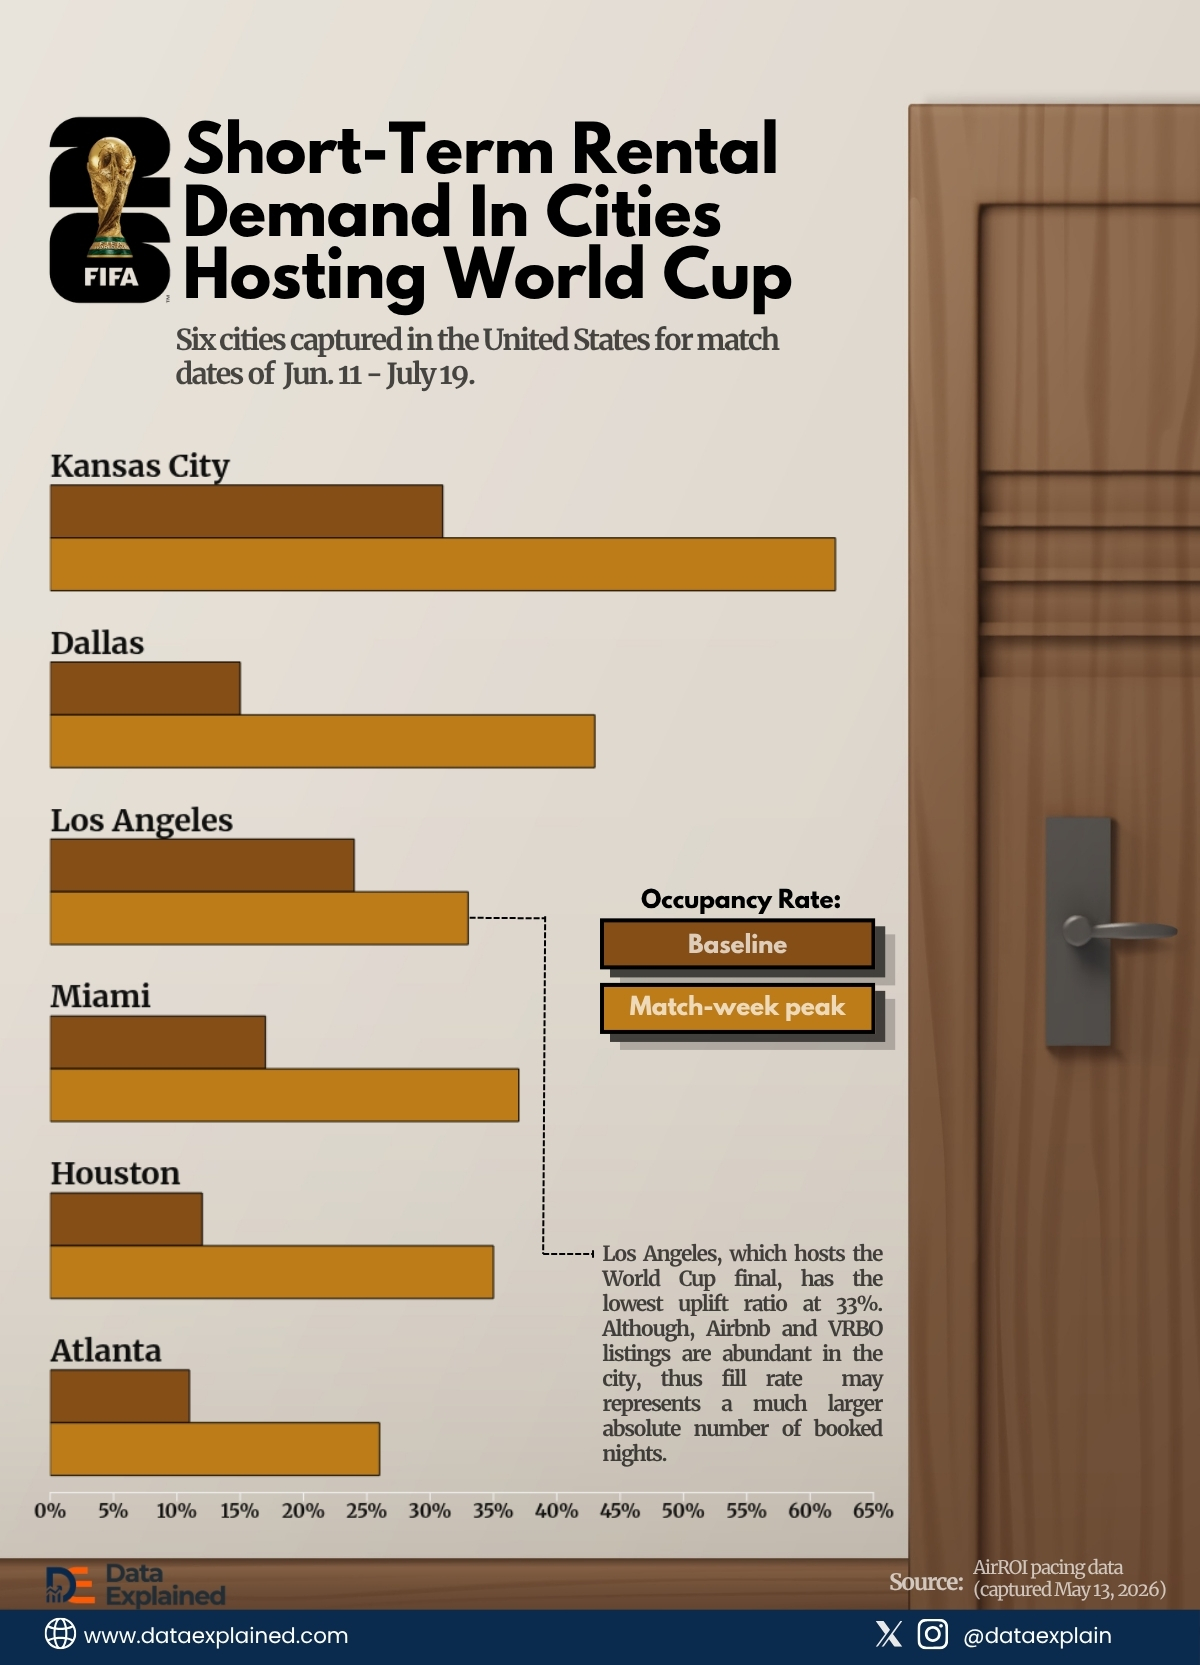
In that vein, this visualization shows short-term rental (STR) fill rates for tournament match dates across key cities. The match dates span from June 11 to July 19.
Short-term rental fill rates simply mean the percentage of time your property has guests staying.
It was obtained directly from AirROI pacing data captured on May 13, 2026.
TL;DR
- Los Angeles, which hosts the World Cup final, has the lowest uplift ratio of any city in the dataset at approximately 1.4x above baseline.
- 80% of surveyed hotels across the 11 US World Cup host cities are tracking below initial occupancy forecasts
- AirROI pacing data shows short-term rental fill rates ranging from approximately 26% in Atlanta to approximately 62% in Kansas City at the match-week peak
| wdt_ID | wdt_created_by | wdt_created_at | wdt_last_edited_by | wdt_last_edited_at | City | Total STR Listings (Approx.) | Baseline Fill Rate (%) | Match-Week Peak Fill Rate (%) |
|---|---|---|---|---|---|---|---|---|
| 1 | emmanuel-ashemiriogwa | 10/06/2026 04:26 PM | emmanuel-ashemiriogwa | 10/06/2026 04:26 PM | Kansas City | 1,800.0 | 31 | 62 |
| 2 | emmanuel-ashemiriogwa | 10/06/2026 04:26 PM | emmanuel-ashemiriogwa | 10/06/2026 04:26 PM | Dallas | 6,200.0 | 15 | 43 |
| 3 | emmanuel-ashemiriogwa | 10/06/2026 04:26 PM | emmanuel-ashemiriogwa | 10/06/2026 04:26 PM | Houston | 12,700.0 | 12 | 35 |
| 4 | emmanuel-ashemiriogwa | 10/06/2026 04:26 PM | emmanuel-ashemiriogwa | 10/06/2026 04:26 PM | Miami | 11,800.0 | 17 | 37 |
| 5 | emmanuel-ashemiriogwa | 10/06/2026 04:26 PM | emmanuel-ashemiriogwa | 10/06/2026 04:26 PM | Atlanta | 8,600.0 | 11 | 26 |
| 6 | emmanuel-ashemiriogwa | 10/06/2026 04:26 PM | emmanuel-ashemiriogwa | 10/06/2026 04:26 PM | Los Angeles | 15,400.0 | 24 | 33 |
What the STR Data Shows
AirROI’s fill rate measures the percentage of total short-term rental inventory booked for World Cup match dates.
The chart compares each city’s baseline fill rate (normal non-event occupancy) against its match-week peak rate during tournament games.
Kansas City leads the dataset at approximately 62% at the match-week peak, against a baseline of approximately 31%.
Dallas follows at approximately 43% peak, compared with approximately 15% baseline.
At the time the data was captured, no city in the list reached a 70% fill rate at the match-week peak.
Kansas City’s Structural Position
Kansas City’s approximately 62% peak is the dataset’s standout figure
Its baseline of approximately 31% is higher than the match-week peak of every other measured city except Dallas.
Part of this reflects market structure rather than raw demand intensity.
Kansas City has a significantly smaller short-term rental inventory than Los Angeles, Miami, or Dallas.
The same absolute number of bookings fills a higher percentage of a smaller total inventory.
Kansas City’s high fill rate is partly a small-market effect, but it is also the only US host city where the World Cup is producing something approaching a genuinely tight STR market.
The Los Angeles Irony
Los Angeles will host the World Cup final, the single most-watched sports broadcast on the planet.
At the time the data was captured, its match-week peak STR fill rate is approximately 33%.
That is the lowest or near-lowest uplift of any measured city and the second-lowest absolute peak.
There’s important context to this.
The city has one of the largest short-term rental inventories of any US market. Airbnb and VRBO listings are abundant.
A 33% fill rate represents a much larger absolute number of booked nights than Kansas City’s 62% because the denominator is much larger.
But fill rate is what the accommodation industry uses to assess event performance against capacity.
So, What?
Hotels below forecast and STRs below potential peak capacity at the same time is not a story about travelers substituting one accommodation type for the other.
If it were, hotel weakness would coincide with STR strength.
Instead, both sectors are recording the same pattern: accommodation demand for the 2026 World Cup in US host cities has not reached the levels either sector projected when building their forecasts and pricing strategies.
Several structural factors may explain the shortfall.
- Demand that would have concentrated in fewer US cities under the traditional 32-team format is now distributed across more locations and two additional national markets.
- The last-minute booking surge that typically accompanies major sporting events
ELI5 (Explain It Like I’m 5)
Hotels across World Cup host cities in the US are less full than expected ahead of the tournament. An Airbnb-style tracker shows the same thing (in most cities): fewer than half of available rentals are booked for match week. Kansas City is the most full at about 62%. Los Angeles, which hosts the final, is the least full, with just about 33% booked. More cities and countries hosting means fewer fans per city than organizers planned for.
Sources:
AirROI pacing data | American Hotel and Lodging Association survey