Money isn’t the same for everyone, and people behave differently because of it.
According to the Bureau of Economic Analysis (BEA), real personal consumption expenditures (PCE), which is the broadest measure of consumer spending, grew 5.6% in 2024 and was estimated to rise consistently in 2025.
But that growth hides a growing divide. New insights from McKinsey & Company show that spending patterns now depend more on income than ever before.
TL;DR
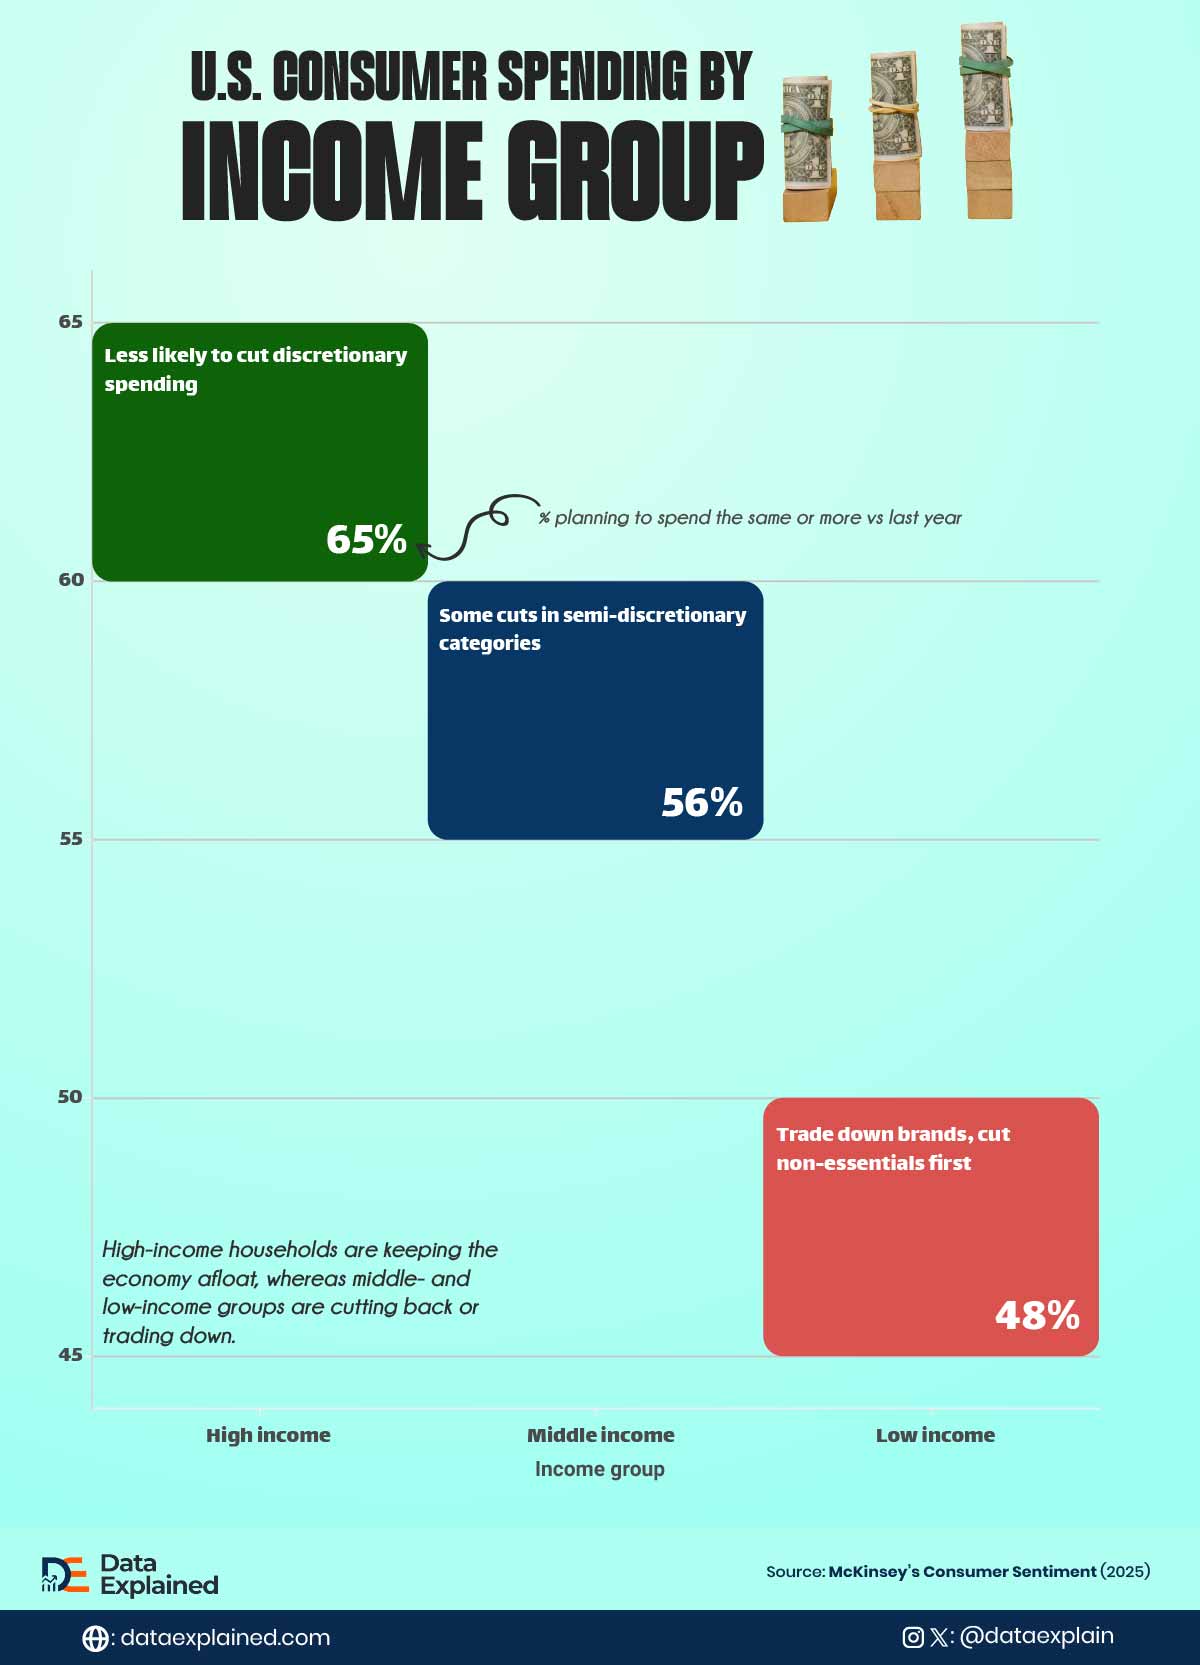
- High-income Americans are keeping the economy afloat, with 65% planning to spend the same or more this year.
- Middle- and low-income groups are cutting back or trading down.
- Overall spending (PCE) still grew 5.6%, helped by rising incomes (+5.5%) and social benefits (+14.4%), even though many households feel stretched.
Spending Intentions By Income Group (2025)
| wdt_ID | wdt_created_by | wdt_created_at | wdt_last_edited_by | wdt_last_edited_at | Income group | % planning to spend the same or more vs last year | Where cuts show up |
|---|---|---|---|---|---|---|---|
| 1 | Monica Ebunoluwa | 23/07/2026 02:25 PM | Monica Ebunoluwa | 23/07/2026 02:25 PM | High income | 65% | Less likely to cut discretionary spending |
| 2 | Monica Ebunoluwa | 23/07/2026 02:25 PM | Monica Ebunoluwa | 23/07/2026 02:25 PM | Middle income | 56% | Some cuts in semi-discretionary categories |
| 3 | Monica Ebunoluwa | 23/07/2026 02:25 PM | Monica Ebunoluwa | 23/07/2026 02:25 PM | Low income | 48% | Trade down brands, cut non-essentials first |
Source: McKinsey ConsumerWise survey summaries
McKinsey’s “State of the U.S. Consumer” report finds that confidence doesn’t always match behavior.
U.S. personal income rose 5.5% (annual rate) in the second quarter of 2025, while transfer payments (government benefits such as Social Security and Medicaid) jumped 14.4%.
This shows that many households rely more on aid than on paychecks.
Meanwhile, high-income consumers (earning over $100,000 per annum) remain the main drivers of growth, with 65% saying they’ll spend the same or more this year.
Middle-income earners ($50,000–$100,000 per annum) are holding steady; 56% plan to spend the same or more than last year.
BEA’s Consumer Spending Breakdown
| wdt_ID | wdt_created_by | wdt_created_at | wdt_last_edited_by | wdt_last_edited_at | Income group | % planning to spend the same or more vs last year | Where cuts show up |
|---|---|---|---|---|---|---|---|
| 1 | Monica Ebunoluwa | 23/07/2026 02:29 PM | Monica Ebunoluwa | 23/07/2026 02:29 PM | High income | 65% | Less likely to cut discretionary spending |
| 2 | Monica Ebunoluwa | 23/07/2026 02:29 PM | Monica Ebunoluwa | 23/07/2026 02:29 PM | Middle income | 56% | Some cuts in semi-discretionary categories |
| 3 | Monica Ebunoluwa | 23/07/2026 02:29 PM | Monica Ebunoluwa | 23/07/2026 02:29 PM | Low income | 48% | Trade down brands, cut non-essentials first |
Data as of 2024
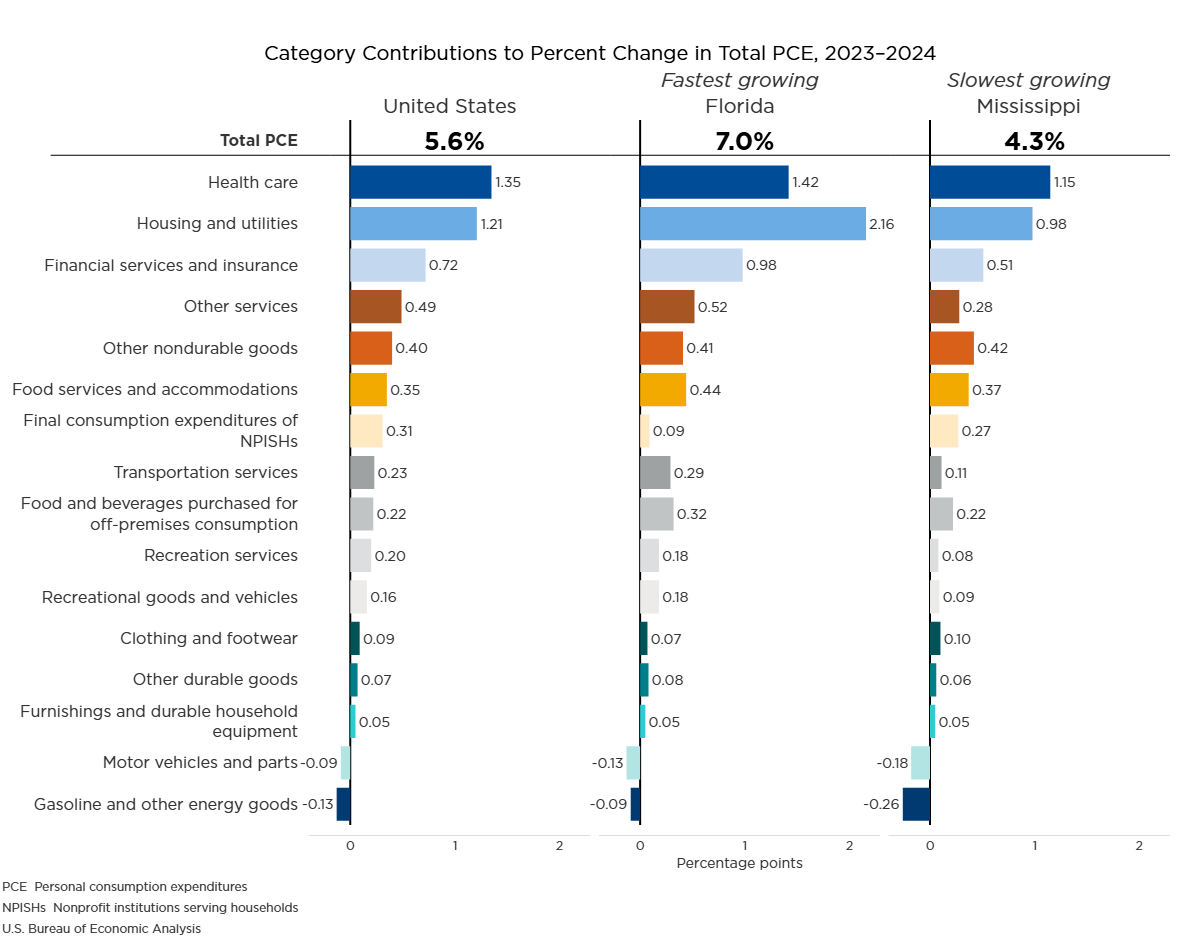
Consumer spending is growing fastest in Florida, Texas, and the Carolinas.
By the way, these are regions with both population growth and strong job markets, while the Midwest and West Coast are slowing.
Between 2023 and 2024, Healthcare, housing, and utilities were the two biggest drivers of PCE growth, together adding more than 2.5 percentage points to total growth.
Meanwhile, gasoline and motor vehicle sales subtracted from PCE growth as people postponed big-ticket purchases.
 Source: BEA’s Q2 2025 GDP & PCE report
What It Means for the U.S. Economy
Economists often describe consumer spending as “two-thirds of GDP.”
That’s true, but the composition of that spending matters. When growth comes mainly from higher-income households, it’s less stable.
These households are sensitive to markets and interest rates, both of which experts had predicted would change direction quickly in late 2025.
Meanwhile, lower-income spending, though smaller in dollar terms, drives the baseline demand for everyday goods (the kind that keeps small businesses, grocery chains, and service workers afloat).
If that base keeps weakening, the economy could feel it before the data shows it.
ELI5
The richest families are keeping the economy strong because most of them plan to spend just as much money (or even more) than they did before.
Regular families and families with less money are trying to spend less. They are either buying fewer things or choosing cheaper options to save money.
The total amount of money spent across the country still went up. This happened because people got raises at work and received extra help from government benefits, even though many families still feel like things are too expensive.
Sources: