
The U.S. President Donald Trump renewed threats to strike Iran if it does not agree to negotiate a new nuclear deal.
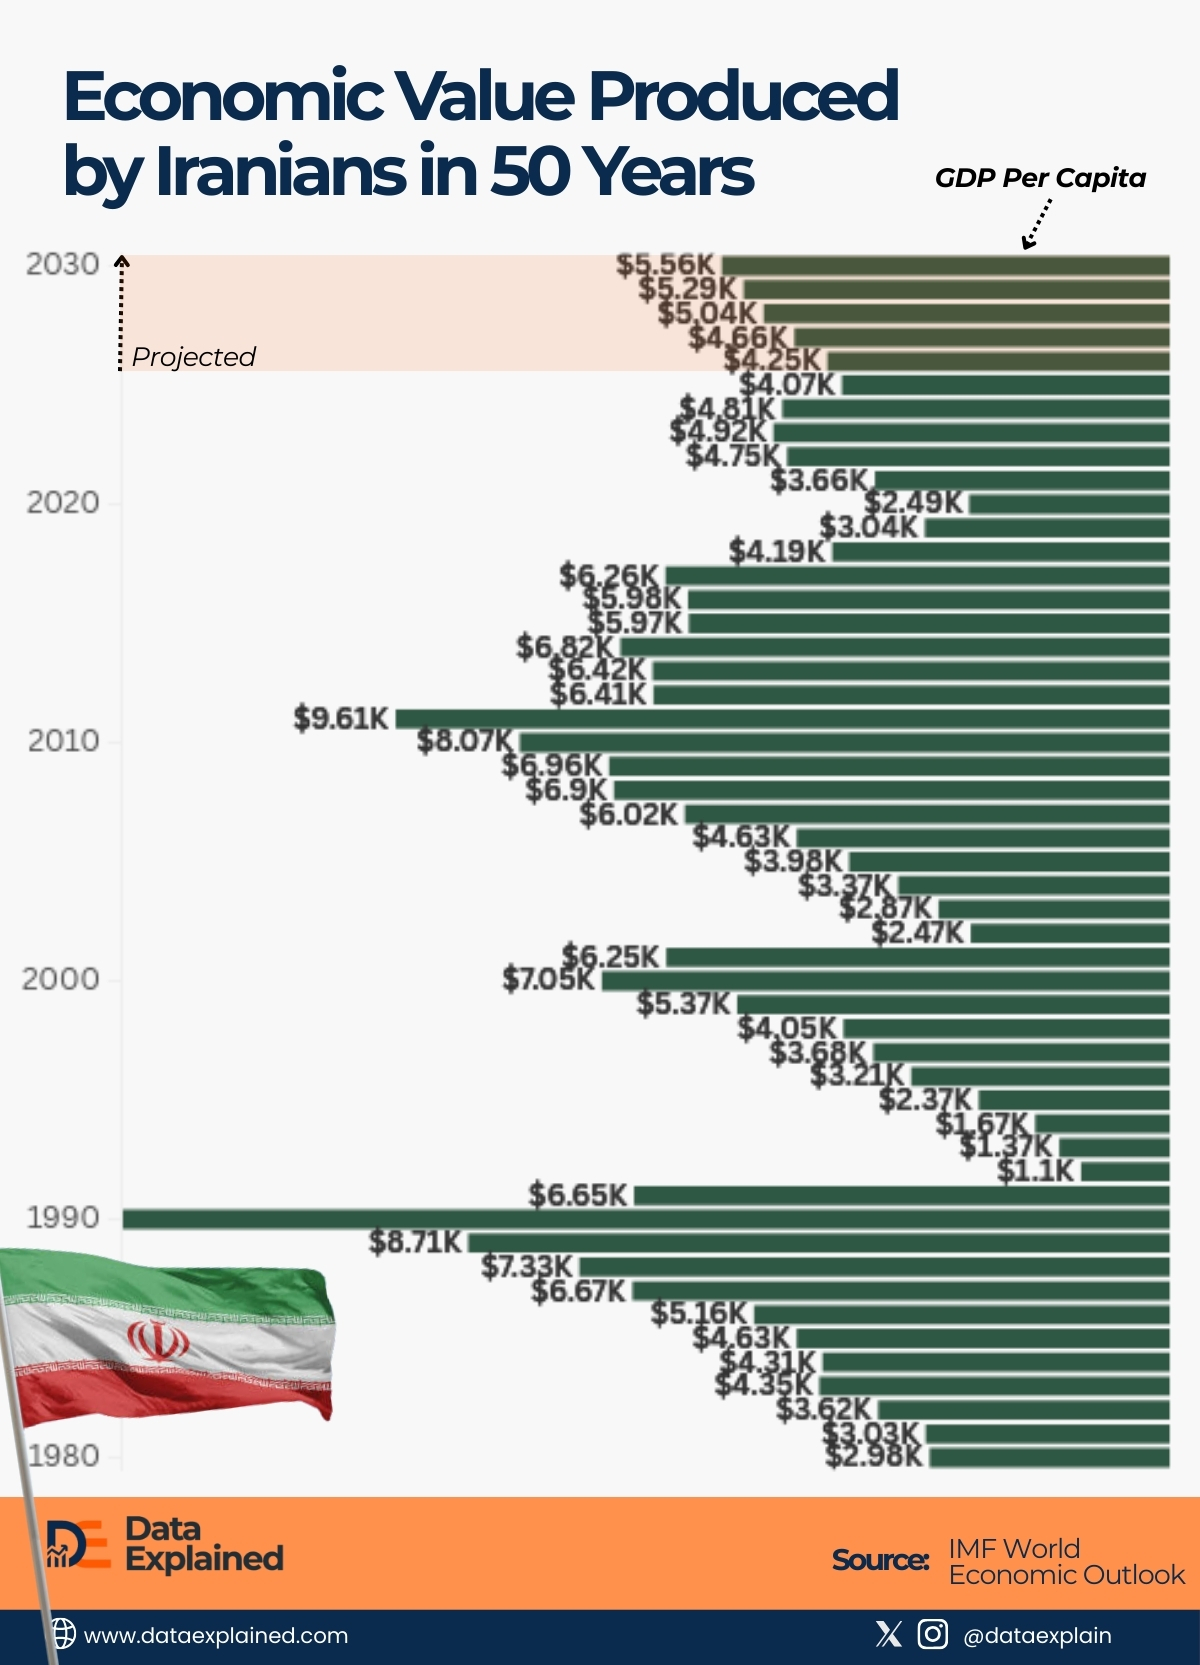
With the current tension, this visualization shows the trend of Iran’s gross domestic product (GDP) per capita from 1980 to a projected 2030.
GDP per capita is a rough, per-person snapshot of a nation’s wealth and productivity.
One interesting pattern to note is how the tragectory of this metric have been heavily impacted by U.S. sanctions.
TL;DR
- Iran’s GDP per capita will be lower in 2030 than 1990 despite 50 years of economic activity.
- Every GDP per capita collapse lines up perfectly with U.S. Sanctions.
- Maximum pressure may paradoxically increase nuclear weapons pursuit.
The 50-year data comes from IMF’s World Economic Outlook database.
Iran GDP Per Capita 1980-2030
| wdt_ID | wdt_created_by | wdt_created_at | wdt_last_edited_by | wdt_last_edited_at | Years | GDP Per Capita (in thousand USD) |
|---|---|---|---|---|---|---|
| 1 | emmanuel-ashemiriogwa | 29/01/2026 04:35 PM | emmanuel-ashemiriogwa | 29/01/2026 04:35 PM | 1980 | 2.98 |
| 2 | emmanuel-ashemiriogwa | 29/01/2026 04:35 PM | emmanuel-ashemiriogwa | 29/01/2026 04:35 PM | 1981 | 3.03 |
| 3 | emmanuel-ashemiriogwa | 29/01/2026 04:35 PM | emmanuel-ashemiriogwa | 29/01/2026 04:35 PM | 1982 | 3.62 |
| 4 | emmanuel-ashemiriogwa | 29/01/2026 04:35 PM | emmanuel-ashemiriogwa | 29/01/2026 04:35 PM | 1983 | 4.35 |
| 5 | emmanuel-ashemiriogwa | 29/01/2026 04:35 PM | emmanuel-ashemiriogwa | 29/01/2026 04:35 PM | 1984 | 4.31 |
| 6 | emmanuel-ashemiriogwa | 29/01/2026 04:35 PM | emmanuel-ashemiriogwa | 29/01/2026 04:35 PM | 1985 | 4.63 |
| 7 | emmanuel-ashemiriogwa | 29/01/2026 04:35 PM | emmanuel-ashemiriogwa | 29/01/2026 04:35 PM | 1986 | 5.16 |
| 8 | emmanuel-ashemiriogwa | 29/01/2026 04:35 PM | emmanuel-ashemiriogwa | 29/01/2026 04:35 PM | 1987 | 6.67 |
| 9 | emmanuel-ashemiriogwa | 29/01/2026 04:35 PM | emmanuel-ashemiriogwa | 29/01/2026 04:35 PM | 1988 | 7.33 |
| 10 | emmanuel-ashemiriogwa | 29/01/2026 04:35 PM | emmanuel-ashemiriogwa | 29/01/2026 04:35 PM | 1989 | 8.71 |
As you can see, Iran’s GDP per capita will be approximately $5,500 in 2030, compared to $2,800 in 1980.
That’s only 96% growth over 50 years, or less than 2% annual growth.
Once you account for population growth and inflation, Iran has experienced essentially zero real economic progress in half a century.
Every GDP Collapse Lines Up Perfectly with U.S. Sanctions
One interesting pattern to note is that every major drop corresponds to sanctions; every recovery to sanctions relief.
Here, the sanctions timeline vs. GDP per capita:
- 1995: First major U.S. sanctions. GDP crashes from $13,000 (1990) to $1,500 (1995)
- 2000-2011: Oil boom and lighter sanctions. GDP recovers to $9,500 (2011)
- 2012: UN/EU/US crippling sanctions (SWIFT cutoff, oil embargo). GDP drops to $3,500 (2014)
- 2015-2017: JCPOA nuclear deal lifts sanctions. GDP stabilizes/slightly recovers
- 2018: Trump exits JCPOA, “maximum pressure” sanctions. GDP crashes back to $2,800 (2020)
- 2020-2030: Trump 2.0 sanctions and COVID. GDP stagnates at $3,500-5,500, projected to remain 50% below the 1990 peak.
The chart proves U.S. sanctions work devastatingly well at economic destruction. But the question is, do they work at changing behavior?
Despite five decades of economic pressure, Iran:
- Still enriches uranium (now to 60%, compared to 3.67% under JCPOA)
- Still builds ballistic missiles (now with ranges up to 2,500km)
- Still maintains regional influence (Hezbollah, Hamas, Houthis, Iraqi militias)
- Still refuses to surrender
What This Means for Current U.S.-Iran Tensions
The current bone of contention is that the U.S. is demanding to abandon ALL uranium enrichment (not even civilian nuclear power), surrender existing enriched uranium stockpiles, curb ballistic missiles program, and end support for regional allies.
To show threat, Donald Trump has deployed the USS Abraham Lincoln (nuclear aircraft carrier) to Arabian Sea.
On their part, Iran is demanding the U.S to lift ALL economic sanctions.
They want to keep ballistic missiles, regional influcence and civilian nuclear program with “some limits”).
Our visualization today shows that economic compliance didn’t protect Iran since 1980.
Sanctions crushed the economy whether Iran had 3.67% enrichment (JCPOA limits) or 60% enrichment (current).
From Iran’s perspective, it’s like: We’ve been economically destroyed for 50 years anyway, so why NOT build a nuclear bomb for protection?
It’s what maximum pressure can cause.
When sanctions leave you economically devastated regardless of behavior, the incentive to appease disappears.
Sources:
IMF’s World Economic Outlook | Aljazeera | Iran Primer